Hi,
How i can use dhtmlxchart in template of dhtmlxdataview?
Hi,
How i can use dhtmlxchart in template of dhtmlxdataview?
Hi
Do you mean that Chart will be a DataView item?
yes, in the dataview item, I want a chart title and a chart
You can do something like this:
	<div id="data_container" style="border:1px solid #A4BED4; background-color:white;width:596px;height:396px;"></div>
	<script>
		data = new dhtmlXDataView({
			container:"data_container",
			type:{
                template: "#divID#",
				height:180
			},
            select: false
		});
        data.attachEvent("onXLE", function (){
            pieChart1 =  new dhtmlXChart({view:"pie", container: document.getElementById("chart1"), value:"#sales#", color:"#color#",legend:{width: 75,align:"right",valign:"middle",template:"#month#"}});
            pieChart2 =  new dhtmlXChart({view:"pie", container: document.getElementById("chart2"), value:"#sales#", color:"#color#",legend:{width: 75,align:"right",valign:"middle",template:"#month#"}});
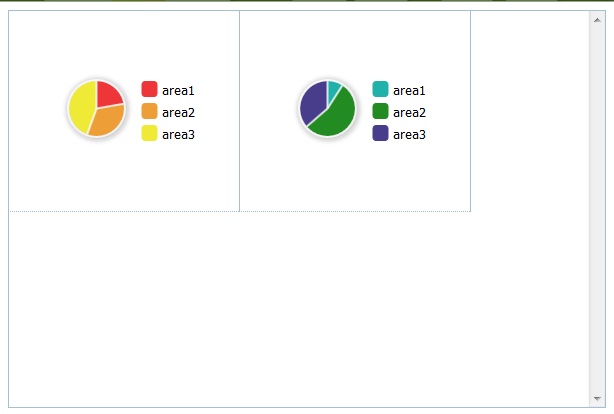
            my_dataset1 = [{ sales: 20, month:"area1", color: "#ee3639" },{ sales: 30, month:"area2", color: "#ee9e36" },{ sales: 40, month:"area3", color: "#eeea36" }];
            my_dataset2 = [{ sales: 10, month:"area1", color: "#20B2AA" },{ sales: 60, month:"area2", color: "#228B22" },{ sales: 40, month:"area3", color: "#483D8B" }];
            pieChart1.parse(my_dataset1,"json");
            pieChart2.parse(my_dataset2,"json");
        });
        data.parse('<data><item id="1"><divID><![CDATA[<div id="chart1" style="width:200px; height: 180px"></div>]]></divID></item><item id="2"><divID><![CDATA[<div id="chart2" style="width:200px; height: 180px"></div>]]></divID></item></data>');
	</script>
Result of thid ceode is the next:

BUT pay attention, what it can hang up because of amount of data.
That is why we recommended using simple divs to place your charts.
Could you provid us info, how do you going to use these charts and why you want to put them into dataview?
And where do you going to ger chart data?
After window resize charts can fade.
I want to create a dashboard
Here is documentation about templates:
docs.dhtmlx.com/doku.php?id=dhtm … :templates
Dataview can be redrawn in several cases. For example on window resize. For this reason using complex object like charts may cause performance problems. It is possible to use charts in dataview, but we do not recommend this approach. You can generate pictures with charts on the server-side and use them in template.
How i can generate picture in server-side (i use PHP) from a dhtmlxChart?
How i can generate picture in server-side (i use PHP) from a dhtmlxChart?
There is not a ready implementation for this. You may try to use something like PhantomJS.
If you decide to create Charts on client, you will need to use renderAll property to disable virtual rendering that causes redrawing on scrolling or page resizing:
DataView = new dhtmlXDataView({
renderAll: true,
…
});
We do not recommend this approach if your dataview contains more than 10-20 items (charts) due to possible performance problems (each chart generates addition set of objects).