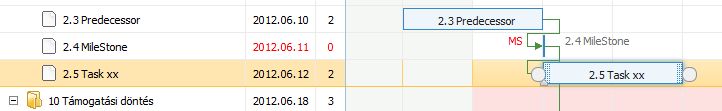
I have tried to visualize a MileStone.
As well as you know, the MileStone is a task with “0” duration, and the MileStone is at the end of the day. The MileStone is very important with its links. So, I have updated a task with “0” duration, and added one plus day to draw the correct situation. The result is below.
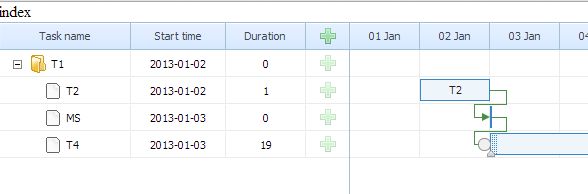
The problem is the next:
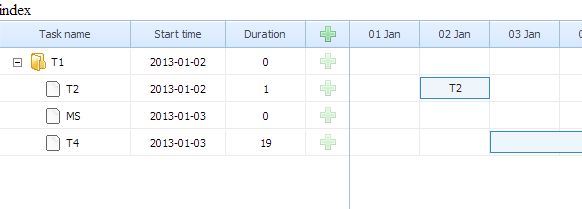
When I have freshed the page, the connector.php make new xml with wrong data.
I expect the render_table and render_links orders kill the MS task and his links.
Have somebody an idea to draw MileStone ???
Thank you in aticipation!
Hi,
currently the only available option for milestones is to render them as tasks with zero duration, as you’ve suggested in your post. Issue with loading should have been fixed in the release version.
You can define different html content and css style for milestones with following templates, although it may be tricky because of small width of milestone elements
docs.dhtmlx.com/gantt/api__gantt … plate.html
docs.dhtmlx.com/gantt/api__gantt … plate.html
Hi,
a good idea to make special CSS for MileStone, but the main problem is the mislaid links of the MS. This problem is in case of database streaming with connector.php.
Hi,
I have found a short cut to visualize MileStone.
Basically setup “0” duration, with corrected “0,02” duration value. A database trigger is able to correct the “0” value for 0,02. Also onligatory: correct the MS date with -1 day.
So, the Gantt Chart is working fine from database…