I want to add a vertical line to a line chart showing the months of a year.
The line should be a marker for the corrent month.
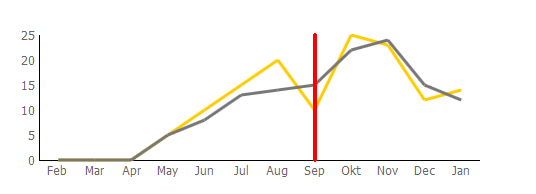
I made a mock-up of what it should look like, see attached screenshot.
I searched the documentation and the forum but did not find a solution.
Is there a method to achieve this, or will I have to go with canvas manipulation?
Hi Daria, thank you very much, that works like a charm!
Is there a similar approach to set the font for the current month to bold?
Right now I use a JQuery call (checking the content of the label divs) to set the css, but it would be nicer if I could also include that in the chart configuration.