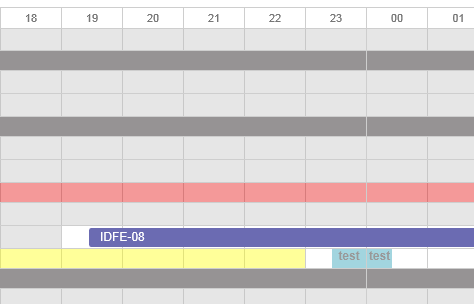
I am using version 4.2 of the scheduler with a limit on my scheduler from 12/31/2013 to 1/2/2014 23:59. I have two main bars in my timeline view, an event and timespans under the event. In the current version of our site both items display correctly. However, we were experiencing a bug where zones going over midnight were not displaying properly. We decided to switch all our timespans to be start/end based instead of zone based. Now they all display correctly however when the timespan crosses over a midnight line it will show the html applied to the timespan, twice. See the attached screen shot.
Code used to apply the timespan:
                scheduler.addMarkedTimespan({
                    start_date: new Date(timespan.start_date),
                    end_date: new Date(timespan.end_date),
                    sections: { timeline: timespan.key },
                    css: "SupplierPickup",
                    html: '<div style="text-align: center; font-weight: bold;">test</div>'
                });
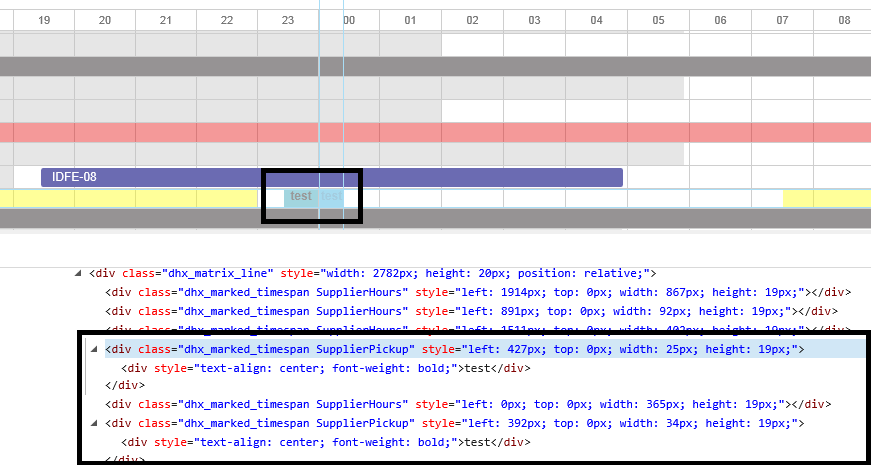
One other weird thing to notice is that our version in production also does not display the thicker midnight line. The vertical bar for midnight seems a few pixels thicker and appears on top of all the bars. Here is the HTML code rendered for the screen shot

Do worry about the thicker midnight line. That was in regards to another line of code I accidentally removed. However I stripped out all other timespans except the on crossing midnight and the associate event.
More details on the split issue though:
WORKING AS A ZONE:
scheduler.addMarkedTimespan({
    days: 3,
    zones: [-35, 25],
    sections: { timeline: 85 },
    css: "SupplierPickup",
    html: '<div style="text-align: center; font-weight: bold;">test</div>'
});
NOT WORKING AS A START/END TIME
scheduler.addMarkedTimespan({
    start_date: new Date("12/31/2013 23:25"),
    end_date: new Date("01/01/2014 00:25"),
    sections: { timeline: 85 },
    css: "SupplierPickup",
    html: '<div style="text-align: center; font-weight: bold;">test</div>'
});
Full Sample HTML
<!DOCTYPE html>
<html xmlns="http://www.w3.org/1999/xhtml">
<head>
<title></title>
<script src="/Scripts/dhtmlxscheduler.js" type="text/javascript"></script>
<script src="/Scripts/ext/dhtmlxscheduler_limit.js"></script>
<script src="/Scripts/ext/dhtmlxscheduler_timeline.js"></script>
<script src="/Scripts/ext/dhtmlxscheduler_treetimeline.js"></script>
<link rel="stylesheet" href="/Content/dhtmlxscheduler.css" type="text/css" />
<style type="text/css">
html, body{
margin:0px;
padding:0px;
height:100%;
overflow:hidden;
}
.section
{
background-color: gray;
opacity:.4;
}
</style>
</head>
<body>
<div id="scheduler_here" class="dhx_cal_container" style='width:100%; height:100%;'>
<div class="dhx_cal_navline">
<div class="dhx_cal_prev_button"> </div>
<div class="dhx_cal_next_button"> </div>
<div class="dhx_cal_today_button"></div>
<div class="dhx_cal_date"></div>
<div class="dhx_cal_tab" name="timeline_tab" style="right:280px;"></div>
<div class="dhx_cal_tab" name="day_tab" style="right:204px;"></div>
<div class="dhx_cal_tab" name="week_tab" style="right:140px;"></div>
<div class="dhx_cal_tab" name="month_tab" style="right:76px;"></div>
</div>
<div class="dhx_cal_header"></div>
<div class="dhx_cal_data"></div>
</div>
<script type="text/javascript">
scheduler.locale.labels.timeline_tab = "Timeline";
scheduler.createTimelineView({
name: "timeline",
x_unit: "hour",//measuring unit of the X-Axis.
x_date: "%H", //date format of the X-Axis
x_step: 1, //X-Axis step in 'x_unit's
x_size: 24, //X-Axis length specified as the total number of 'x_step's
x_start: -4, //X-Axis offset in 'x_unit's
x_length: 8, //number of 'x_step's that will be scrolled at a time
y_unit:[
{key:"1", label:"Driver #1", open:true, children:[
{key:"2", label:"ABC-00", open:true, children:[
{key:"3", label:"00001"},
{key:"4", label:"00002"}
]},
]}
],
y_property: "section_id", //mapped data property
render: "tree" //view mode
});
scheduler.init('scheduler_here', new Date("01/01/2014"), "timeline");
var events = [
{ id: 1, text: "ABC-00", start_date: "01/01/2014 08:00", end_date: "01/01/2014 14:00", section_id: "2" }
];
scheduler.parse(events, "json");
scheduler.addMarkedTimespan({
days: 3,
zones: [-120,3*60],
sections: { timeline: 3 },
css: "section",
html: "<div style=\"text-align: center\">Test</div>"
});
scheduler.addMarkedTimespan({
start_date: new Date("12/31/2013 22:00"),
end_date: new Date("01/01/2014 03:00"),
sections: { timeline: 4 },
css: "section",
html: "<div style=\"text-align: center\">Test 2</div>"
});
scheduler.updateView();
</script>
</body>
</html>

