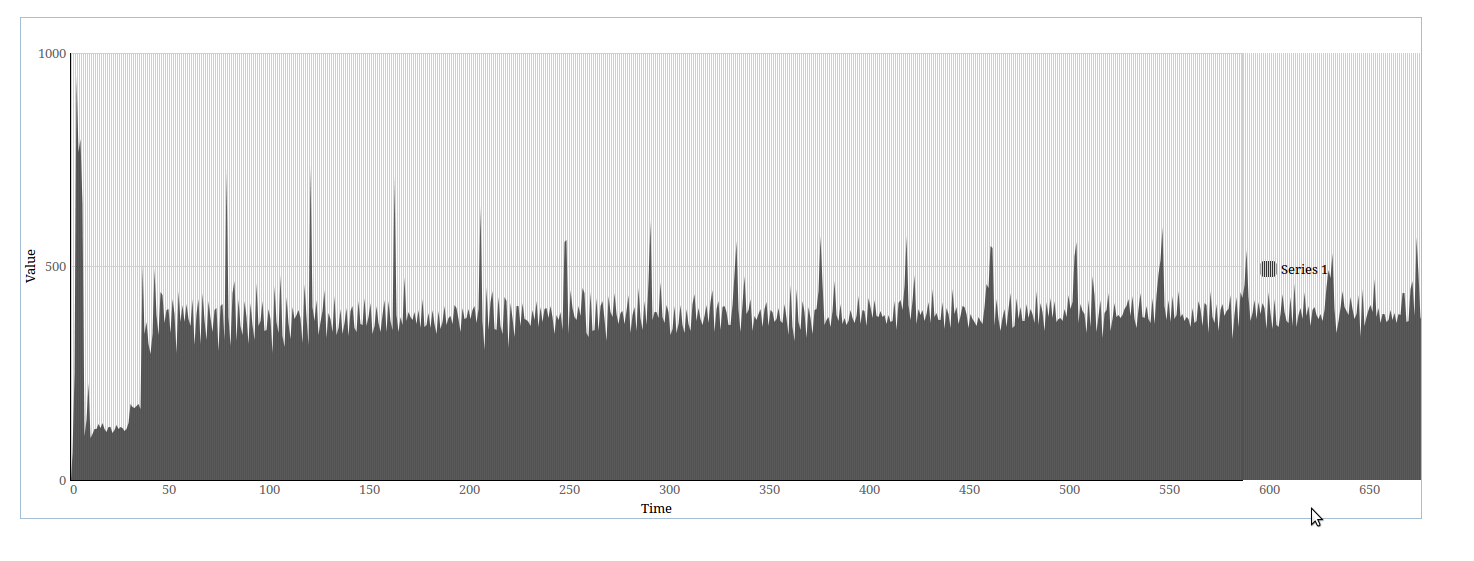
When using dhtmlxChart to build area graphs, I often run into cases where the graphs “overflow” the right-hand side of the graph. A screenshot example is attached.
I had a similar problem before (viewtopic.php?f=8&t=26449), but even when I use the updated version of dhtmlxChart from that post, I still run into issues like the one here.
I have attached a zip of the code and data I used to generate this case, in case you need it.
I upgraded to version 3.6, but this issue remains. I really like dhtmlx charts, but unfortunately this bug affects a lot of the graphs I produce. Is there any way to fix it it?
I downloaded 3.6 again, and now the problem is fixed (my previous download must have been wrong, because the files are completely different this time).
Anyways, sorry for the false alarm and thanks for the fix!