Hi,
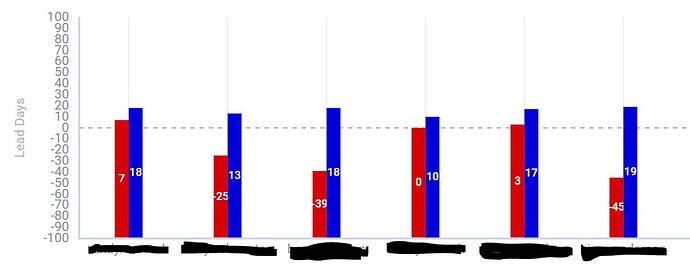
I am using bar chart and have both positive and negative values. When I set the left min scale to a negative value (e.g. left: {min: -100, max: 100 …}) it makes the origin line the same as the min value instead of 0. All my negative value bars stay above the origin line scaled disproportionally as shown in the below graph:
Is there a way to define start, end, steps in DHTMLX Suite 7.0 without overriding the min scale? I know this option exists in older versions.
Thanks in advance.
