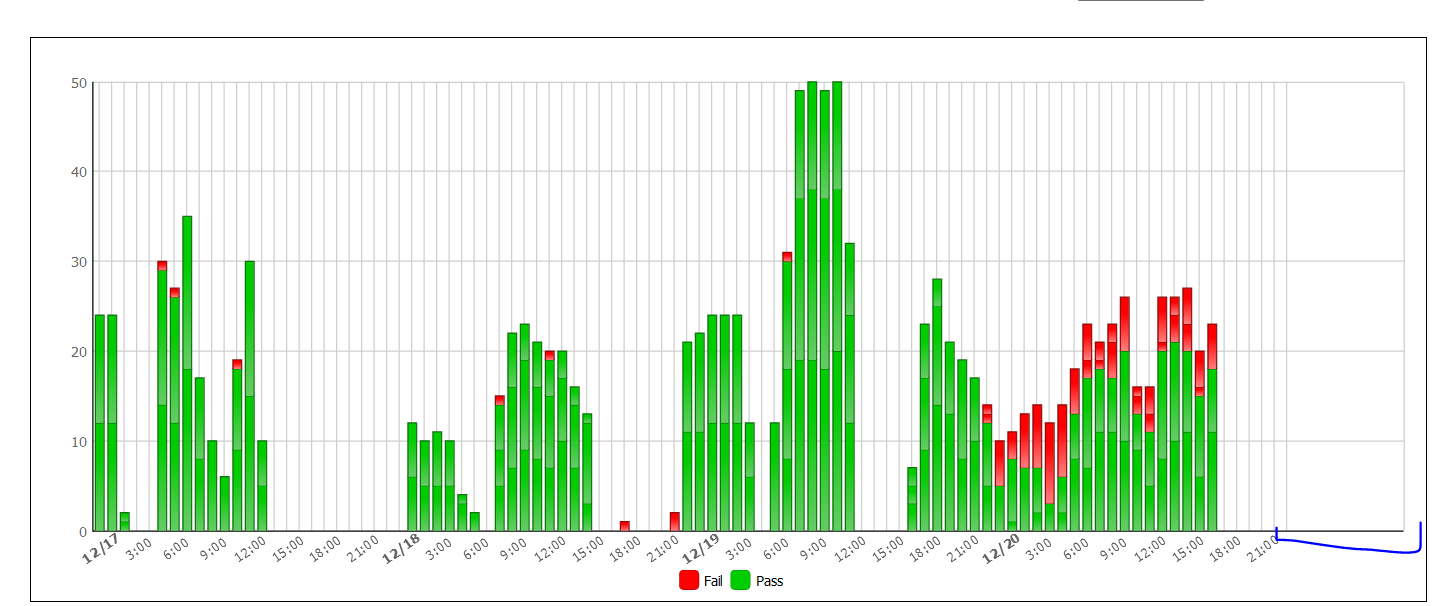
I have a chart that has a variable time range. The chart looks good up to a point, but If I have a lot of data, there is a blank space at the end of my chart (picture attached). Is there a way to fix this?
Hello,
we have reproduced the problem. Which version are using PRO or Standard ? If you are using PRO please open a ticket in Members’ support. In case of STD version, please attach the library that you are using.
I am using dhtmlxChart v.4.0.3 Standard edition