Hello,
First of all: thanks a lot for providing such a great library: powerful, beautiful, and easy to use ![]()
However, i’m facing a problem:
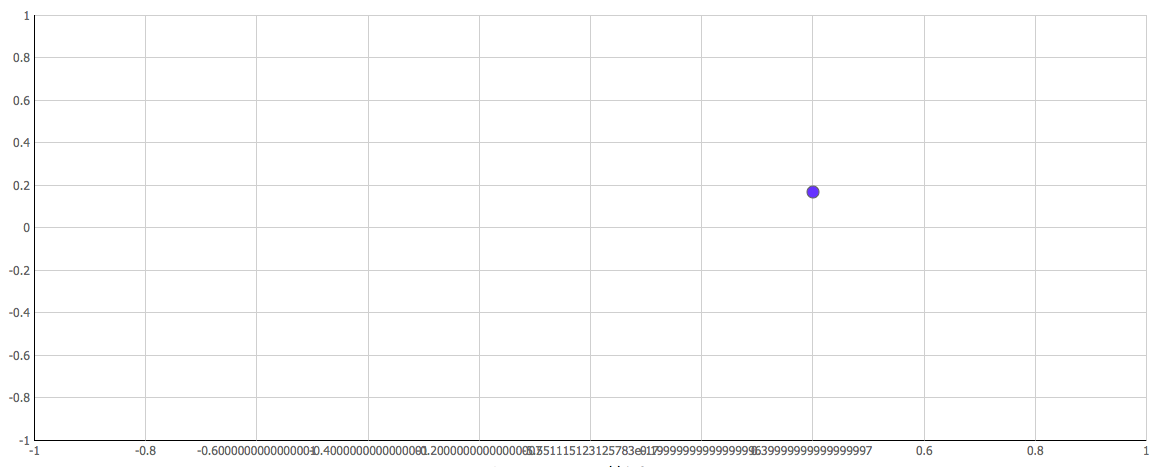
I’m making a scatter chart on which both axis go from -1 to +1, with steps of 0.2; here the relevant part of my code:
			yAxis:{
				start:-1,
				end:1,
				step:0.2
			},
			xAxis:{
				start:-1,
				end:1,
				step: 0.2
			},
That works perfectly on the Y-axis, but here are the labels displayed below the X-axis:
I have similarly weird results with steps of 0.1; steps of 0.5 work fine, but are too wide for my needs
I don’t really expect you to have a solution for me right now (but if you have, feel free to tell me :p), but if you had some time to check that for the next version, that could be great ^^
Thanks for reading me, and have a nice day ![]()
PS: the problem appears on both Firefox and Chrome (last versions)