I can not get the addSeries to display the bars for “Failed” Inspections…, Am I doing this wrong? ![]()
										<center>
											<div id="chart_container_2" style="width:290px;height:170px;display:inline-block;margin-top:5px;"></div>
											<div id="gridbox_2" style="width:350px; height:170px; overflow:auto; background-color:white;display:inline-block;margin-top:5px;"></div>
										</center>
										<script>
											var barChart_2, mygrid_2;
											function initDashlet_2(){

												data_2 = {
													rows: [
												      {id: 1001, data: [ "APAC",	"IPI",   	"15", 	"13", 	"2",	"13%" ]},
												      {id: 1002, data: [ "APAC",	"IFA",   	"18", 	"14", 	"4", 	"22%" ]},
												      {id: 1003, data: [ "APAC",	"Regular", 	"74", 	"62",   "12", 	"16%" ]},
												      {id: 1004, data: [ "EMEA",	"IPI",   	"13", 	"8", 	"5",	"38%" ]},
												      {id: 1005, data: [ "EMEA",	"IFA",   	"15", 	"12", 	"3", 	"20%" ]},
												      {id: 1006, data: [ "EMEA",	"Regular", 	"103", 	"98",   "3", 	"5%" ]},
												      {id: 1007, data: [ "NA",		"IPI",   	"13", 	"8", 	"5",	"38%" ]},
												      {id: 1008, data: [ "NA",		"IFA",   	"18", 	"14", 	"4", 	"22%" ]},
												      {id: 1009, data: [ "NA",		"Regular", 	"89", 	"62",   "27", 	"36%" ]},
													]
												}
												barChart_2 = new dhtmlXChart({
												    view: "bar",
												    color: "#1DCC2B",
												    gradient: "3d",
												    container: "chart_container_2",
												    value: "#data3#",
												    label: "#data3#",
												    radius: 3,
												    width: 30,
												    origin: 0,
												    yAxis: {
												        start: -0,
												        step: 25,
												        end: 125,
												        lines:true,
												        title:"Inspections"
												    },

												    group: {
												        by: "#data0#",
												        map: {
												            data3: ["#data3#", "sum"]
												            }
												    },
												    xAxis: {
												        template: 	"#id#",
												        title:		"Region"
												    },
												    border: false,
												    padding:{
												    	top:15,
												    	left:45,
												    	right:10,
												    	bottom:30
												    },
													legend:{
														width: 55,
														align:"right",
														valign:top,
														marker:{
															type:"round"
														},
													    values:[
															{text:"Passed",color:"#1DCC2B"},
															{text:"Failed",color:"#CC2B3A"}
															]
													},

												});

												barChart_2.addSeries({
														value: "#data4#",
														color: "#CC2B3A",
														label: "#data4#",
												   		group: {
													        by: "#data0#",
													        map: {
													            data4: ["#data4#", "sum"]
													            }
													    }
													})
												barChart_2.refresh();


												barChart_2.attachEvent("onMousemoving", function (ev){
													return false
												});
												mygrid_2 = new dhtmlXGridObject("gridbox_2")
												mygrid_2.setImagePath('./js/dhtmlxGrid/codebase/imgs/');
												mygrid_2.setSkin("dhx_skyblue");
												mygrid_2.setHeader("Region, Division, Inspections, Passed, Failed, Failure Rate");
												mygrid_2.setEditable(false,false,false,false,false,false);
												mygrid_2.setColTypes("ro,ro,ro,ro,ro,ro");
												mygrid_2.setInitWidthsP("15,15,20,20,15,*");
												mygrid_2.setDateFormat("$GRID_CALENDAR_FORMAT");
												mygrid_2.init();
												mygrid_2.enableTooltips("false,false,false,false,false,false");
												mygrid_2.enableMultiline(false);
												mygrid_2.enableAutoHeight(true);
												mygrid_2.parse(data_2, function(){
												   refresh_chart_2();
												  // mygrid_2.groupBy(0);
												}, "json");
											}
											function refresh_chart_2() {
											   	barChart_2.clearAll();
											   	barChart_2.parse(mygrid_2, "dhtmlxgrid");
											}

											initDashlet_2()
										</script>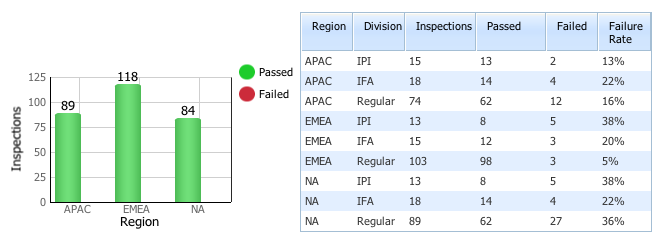
 ROCK ON!