Hi!
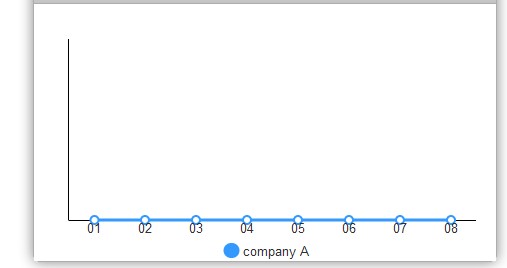
I use char view ,but the data cann’t show ,the yAxis vale of the char just aways show 0.
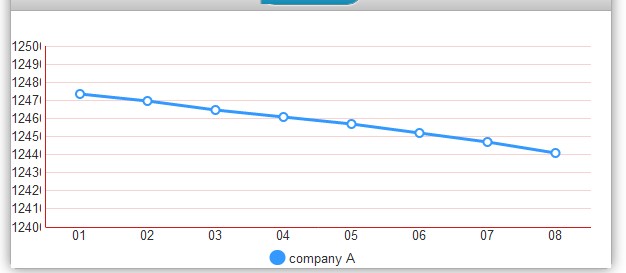
var lineData =[{"comDate":"01","id":"1","mobile":"12474"},{"comDate":"02","id":"2","mobile":"12470"},{"comDate":"03","id":"3","mobile":"12465"},{"comDate":"04","id":"4","mobile":"12461"},{"comDate":"05","id":"5","mobile":"12457"},{"comDate":"06","id":"6","mobile":"12452"},{"comDate":"07","id":"7","mobile":"12447"},{"comDate":"08","id":"8","mobile":"12441"}]

		var lines = {
			view:"chart",
			type:"line",
			id:"lines",
			series:[
				{
			    	value:"#mobile#",
					item:{
						borderColor: "#3399ff",
						color: "#ffffff"
					},
					line:{
						color:"#3399ff",
						width:3
					}
				}
			],
			xAxis:{
				template:"#comDate#"
			},
			yAxis:{

			},
			padding:{
				left:35,
				bottom:20
			},
			origin:0,
			legend:{
				layout:"x",
				width: 75,
				align:"center",
				valign:"bottom",
				marker:{
					type:"round",
					width:15
				},
				values:[
					{text:"company A",color:"#3399ff"},
					{text:"company B",color:"#66cc00"}
				]
			},
			data: lineData,
			datatype: "json"
		};

		dhx.ready(function(){
			dhx.ui({
				view:"window",
				body:"SubBar",
				head:{
					view:"toolbar", id:"viewsbar",  type:"SubBar",  elements:[
						{view:"segmented", align:"center", id:"chart_types", multiview:true, options:[
							{value:"lines", label:"Line Chart"}
						]}
					]
				},
				top:250,
				left:400,
				height:300,
				width:462,
				move:true,
				body:{
					type:"multiview",
					cells:[
						lines
					]
				}
			});
		})
Thx for help in advance!