Chart and Grid doesn't work for me :-(

Hello,
Hope someone can help.
Here’s my code sample :

[code]// Chart Config
var configChart = {
view:“bar”,
color:“#66ccff”,
gradient:“3d”,
//container:“chart_container”,
value:“#data3#”, // AMOUNT2
label:“#data3#”, // AMOUNT2
radius:3,
width:50,
origin:0,
yAxis:{
start:0,
step:1000,
end:3000
},
xAxis:{
template:“#data0#” // Day of the Week
},
border:false
}

// Chart initialisation
myChart = myRightLayout.attachChart(configChart);

// My Grid
var myGrid= myLeftLayout.attachGrid();
myGrid.setIconsPath(‘includes/js/dx/imgs/’);
myGrid.setColTypes(“ro,ro,ron,ron,ron,ron”);
myGrid.loadXML(“data/mydatas.php?action=getxml&etc=”+ new Date().getTime(), refresh_chart);
// mydata.php returns some xml data (see below)

function refresh_chart(){
myChart.clearAll();
myChart.parse(myGrid, “dhtmlxgrid”); // dhtmlgrid or xml ???
}

// the xml

<?xml version="1.0" encoding="UTF-8"?> DAY DATE AMOUNT1 AMOUNT2 AMOUNT4 AMOUNT5 px ven 02/11/2012 1200.00 1435.20 235.20 2.5 mer 31/10/2012 1200.00 1435.20 235.20 3 mar 30/10/2012 600.00 717.60 117.60 3 lun 29/10/2012 420.00 502.32 82.32 2.10 [/code]

I guess #data0# is my 1st column, #data1# my 2nd…
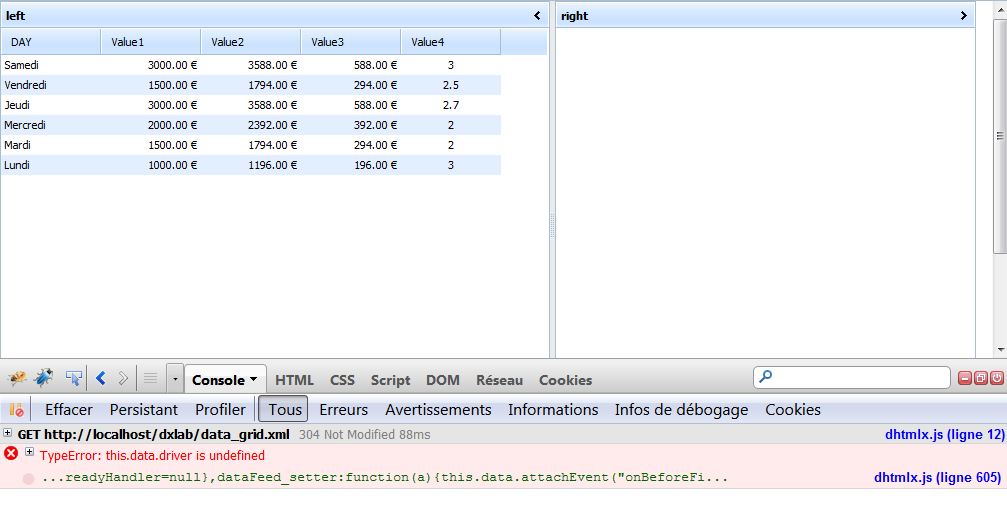
The chart still appears without any values… (only with X and Y axis)

Firebug says : “TypeError: data.documentElement is undefined”

Thanks for you help

You code works locally and “dhtmlxgrid” is the correct driver type.

myChart.parse(myGrid, “dhtmlxgrid”);

If the problem is still actual, please send the complete demo that reproduces the problem.

Hi Alexandra and thanks for your help.

Here are my complete test files :

1°) index.php

[code]

    <title>DHTMLX Lab</title>
    <style>
.dhx_axis_item_x{
    font-size: 11px
}
.dhx_axis_item_y{
    font-size: 11px
}
</body>
[/code]

2°) labs.js

[code]function runMyApp(){
dhtmlx.image_path=‘imgs/’;

var main_layout = new dhtmlXLayoutObject('main', '2U');

var right = main_layout.cells('b');
right.setText('right');
var myChart = right.attachChart({
                            view: "bar",
                                    color: "#66ccff",
                                    gradient: "3d",
                                     // Values I want to display
                                    value: "#data2#",
                                    label: "#data2#",
                                    radius: 3,
                                    tooltip: {
                                        template: "#data0#"
                                    },
                                    width: 50,
                                    xAxis: {
                                        template: "#data0#"
                                    },
                                    border: false
});

var left = main_layout.cells(‘a’);
left.setText(‘left’);
left.setWidth(‘550’);

var myGrid = left.attachGrid();
myGrid.setIconsPath(‘imgs/’);
myGrid.load(‘data_grid.xml’, ‘xml’);
myGrid.init();

myChart.parse(myGrid,“dhtmlxgrid”)// loads grid’s data to the chart

// I commented the hereunder lines as I thought there are unuseful in my case (I mean, using them won’t make my code work)

//function refresh_chart(){ // the function is called every time data in the grid is changed
// myChart.clearAll();// clears chart dataset
// myChart.parse(mygrid,“dhtmlxgrid”); //loads new grid data to the chart
//};
//
//myGrid.attachEvent(“onEditCell”,function(stage){// fires after the editor is closed
// if (stage == 2)// specifies stage of editing. 2 means that event will be fires after the editor is closed
// refresh_chart();// calls the function defined before
// return true;
//});

}[/code]

3°) the data in xml format

[code]<?xml version="1.0" encoding="UTF-8"?>

DAY Value1 Value2 Value3 Value4 px Saturday 3000.00 3588.00 588.00 3 Friday 1500.00 1794.00 294.00 2.5 Thursday 3000.00 3588.00 588.00 2.7 Wednesday 2000.00 2392.00 392.00 2 Tuesday 1500.00 1794.00 294.00 2 Monday 1000.00 1196.00 196.00 3 [/code]

I’m enclosing the result in a screen-shot with the Firebug Message.
This should be basic but it still does not work for me :frowning:
Can the issue come from my dhtmlx version ? (I’m currently using 3.0 pro)

Thanks again !


Well, I think I understand now…

I tried with other files than my dhtmlx.js and dhtmlx.css.
and used the samples js/css files provided in the samples codebase folder…

and then it works.

All my dhtmlx files come with the full folder named “dhtmlx_pro_full.zip”.

It looks like the release I’ve been sent is really missing some functions. the 3.5 is buggy too.

So what am I supposed to do now ?

Thanks

Hello,

we have found an issue in dhtmlx.js. Please contact us at Members’ Support or at sales (at) dhtmlx.com - and we’ll send the fixed library.

Hi Alexandra.
Ticket submitted.
Thanks