Hi,
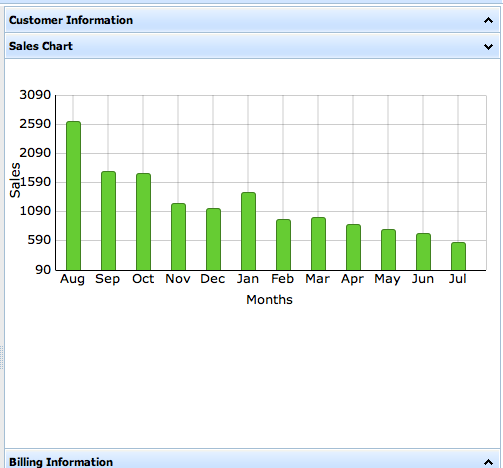
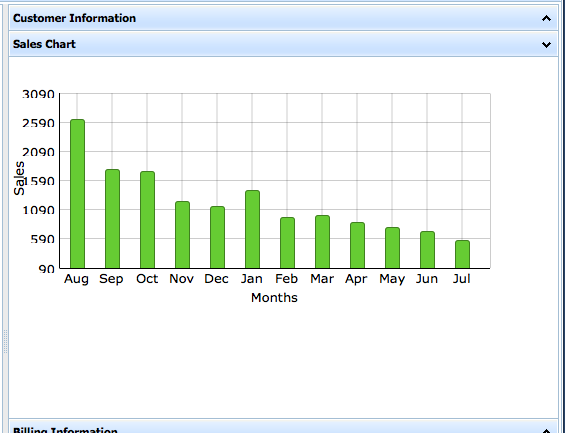
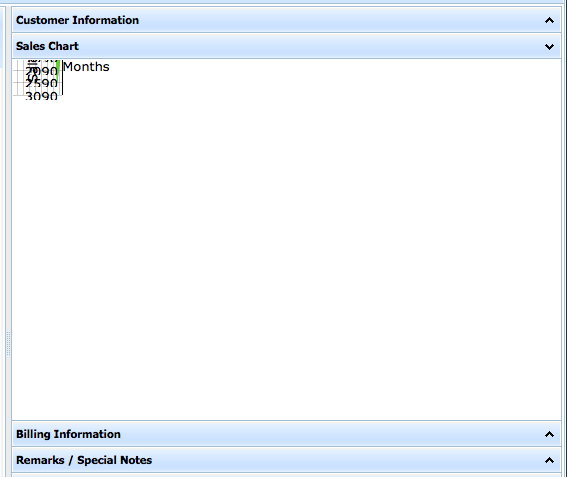
I setup a chart within an accordion. It works perfectly with Safari & Google Chrome, but it doesn’t display properly with Firefox 5.0.1 (Mac OS Lion) if the tab for the displayed chart is not opened.
I attached the screen shots to better explain the problem.
I can’t see which options I’m missing or how I can fix this problem in Firefox 5.0.1.
Thanks,
Stephan Monette
I think this is something to do with the CSS code.
If I change my DIV style, I get the same error on all browsers. Here’s my DIV declaration:
<div id="chart_custinfo" style="width:90%;height:90%;border:1px solid #A4BED4;position: absolute; left: 20px; top: 20px;"
Here’s the HTML code:
Annual Sales
<link rel="stylesheet" type="text/css" href="/js/codebase/dhtmlxchart.css">
<script src="/js/codebase/dhtmlxchart.js"></script>
I found a way around this problem. I attach the onActive event and only create the chart when the accordion cell is active:
CustomerAccord.attachEvent("onActive",doShowChart);

function doShowChart(itemId, state) {
    if (itemId=="a2") {
        var MyRowID=mygrid.getSelectedRowId();

        CustomerAccord.cells("a2").attachURL("/tabcontent/customers/getcustsales.php?custnum="+MyRowID);
    }
}
You may also try to use attachChart method to initialize a chart inside accordion cell (an iframe won’t be used in this case):
var chart = CustomerAccord.cells(“a2”).attachChart({
view: “bar”,
value:"#sales#",
tooltip: “#sales#”,
color: “#66ccff”,
gradient: “3d”,
padding:{
top: 20,
left:60,
bottom: 50
},
xAxis:{
title:“Months”,
template:"#month#",
lines: true
},
yAxis:{
template:"{obj}",
title:“Sales”
}
});
chart.load(“gettotalsales.php?custnum=900052”,“xml”);
And to reload chart with new data, you’ll need to clear chart and load the new data.
chart.clearAll();
chart.load(“gettotalsales.php?custnum=900053”,“xml”);
I didn’t see the AttachChart function documented in the API.
Here’s the API: docs.dhtmlx.com/doku.php?id=dhtm … components
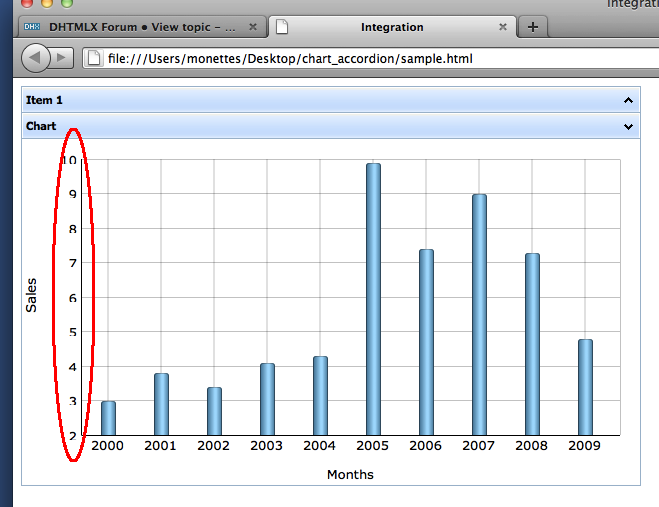
Also, why do I get the Y-Scale numbers clipped when using FireFox? I do not get this problem with Chrome & Safari.
Thanks,
Stephan Monette
We the method is missed. We’ll necessarily add it.
The issue was not reproduced with the 3.0 version. However, the issue looks like the chart size was not calculated. You may try to use the same approach as you used in case of an iframe - call the chart intialization when accordion item is opened first time.
I have the chart with Accordion fixed.
Why do we have the font clipped(bottom of the fonts are clipped) in the chart using FireFox 5.0.1?
The fonts appears perfectly on Safari & Chrome.
I’m using a MAC OSX 10.6.x
Thanks,
Stephan Monette
Why do we have the font clipped(bottom of the fonts are clipped) in the chart using FireFox 5.0.1?
The problem was not reproduced locally - check attached sample
chart_accordion.zip (91.2 KB)
I loaded your example and I do get the clipped fonts on the Y-Scale.
I attached a screen shot with the result circled in red.
FYI: I use a MAC OSX 10.6.x with FireFox 5.0.1.
I do not get this clipped font issue when using Safari and Chrome.
Try to set the following style after dhtmlxchart.css
.dhx_axis_item_y{height:15px;}
Hope it’ll resolve the problem.
Thanks!
Everything shows up perfectly now.
I’m getting the hang of this DHTMLX library stuff.
Hope the customer accepts my demo!
Stephan Monette