Using the dhtmlxchart from the suite.
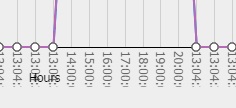
Rotated the X-as values with css, but now the canvas/container? of the chart is to small (see attached picture). The x-as values are cut off at the bottom and there is no room for the x-as title. Tried with css to change height, padding-botom, etc. Only thing which changes the room at the bottom is by changing element.style height in:
etc..
in browser tool, so this is hard coded. Where can I fix this in the script code?
Thanks