Hi,
I’m using DHTMLX Pro v3.6 , and trying to put a chart inside a dataview cell
i tried to use the technique in this post
[url]Dhtmlxchart in dhtmlxdataview - Suite 5.0 - DHTMLX
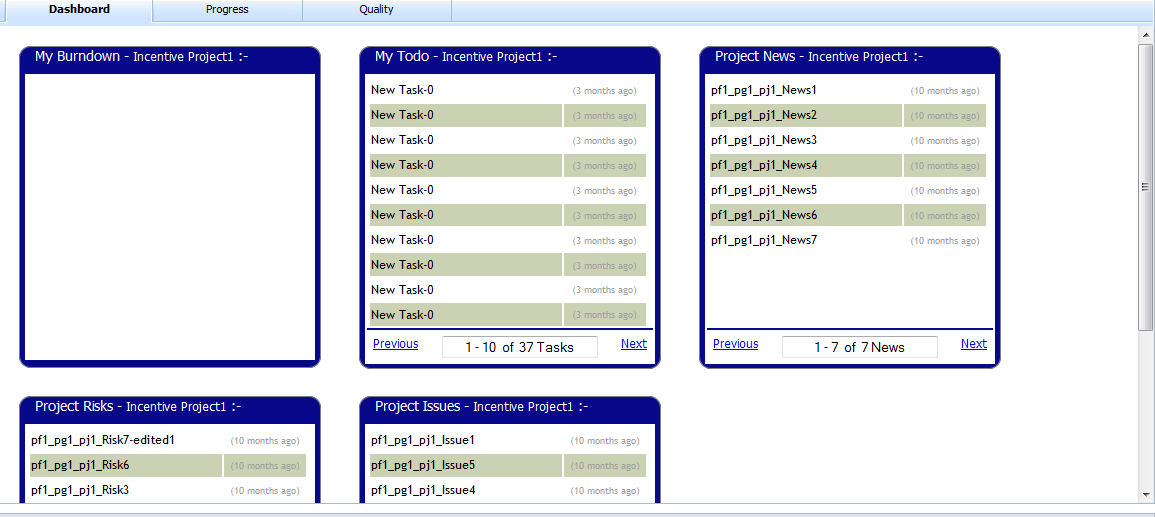
but still the chart(burndown in the attached pic) doesn’t render inside the cell
it neither worked on XLE or after load events
My Code :
CDashboard = CDashboardTab.attachDataView({
        renderAll: true,
        type:{
                template:"<div id='#ID#' class='DashbClass'><span style='height:20px;padding:2px 15px;font-weight:60;font-size:14px;color:White;'>#Name#<span style='font-weight:20;font-size:12px;color:White;'>#ProjName#</span> :-</span><table style='width:290px;height:280px;background-color:White;margin:10px 5px 4px 5px;'>#Content#</table></div>",
                css: "borderless",
                width: 320,
                height: 330
        },
        select: false ,
        drag : true
});
CDashboard.attachEvent("onXLE", function (){
        DashbBurndownChart = new dhtmlXChart({
           view:"line",
           container: document.getElementById("DashbBurndownCont"),
           value:"#Pln#",
           label:"",
           tooltip: "#Pln#",
           item:{ radius:2,borderColor:"#ffffff", color:"#000000" },
           line:{ color:"#ff9900", width:2 },
           xAxis:{ title:"Period", template:"#Period#" },
           yAxis:{ start:0 ,title:"Value" } ,
           legend:{ values:[{text:"Planned",color:"#ff9900" },{text:"Realized",color:"#36abee"}],
                   toggle:true ,
                   margin:0,
                   padding:0,
                   align:"left",
                   width:150,
                   layout:"x"
           }

       }) ;
});
CDashboard.load(“/getDashboard.php?ProjID=”+ProjID,“json”,function(DashboardData){
});
Thanks in advance
MOTASH