Hi.
In the next chart
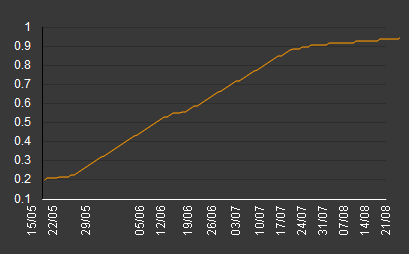
Is created using the next data (Only using Value2 vs Value 1). Value3 is the x-Label (only display if the date is sunday)
but the space between dates is not constant and this deforms the chart. I expect the labels are at the same space, but I have jumps (look at 22/05 and 29/05 and 05/06). In this intervals i have more data. How can fix this???
and I want vertical lines only in the points with labels. If I configure the “lines” propertys, I have lines in every data (so, I have vertical lines every 2 or 3 pixeles), not in every label. Can I write some function to configure the vertical lines???
Thanks for your help