Coloring periods from date to date in the gantt

Hello.
I’m trying to highlight some periods with colors in my gantt.
And i’m using specific scales thanks to the zoom to fit function : Gantt : Samples

So in my example my gantt look like this :

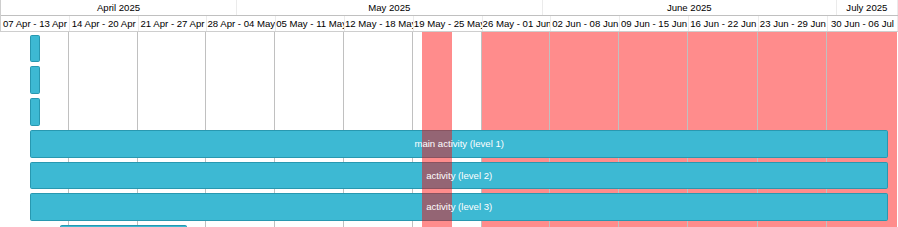
For the red part on the right, i used this :

		const time_slot_start_date = new Date(2025, 4, 20);
		const time_slot_end_date = new Date(2025, 4, 23);
		gantt.templates.timeline_cell_class = function(task, date){
			console.log(date);
			if (date >= time_slot_start_date/* && date <= time_slot_end_date*/){
				return "custom-timeslot" ;
			}
		};

But as it colors only cells, it seems to not be able to color specific date range within a cell (like 05/20 to 05/23 within the period 05/19-05/25)

So i tried something else : markers.
I found out that i can specify an end date on markers, which does exactly what i want : color a period

		// enable markers / time slots
		gantt.plugins({ marker: true });
		// test time slot
		gantt.addMarker({
			start_date: new Date(2025, 4, 20),
			end_date: new Date(2025, 4, 23),
			css: "custom-timeslot",
			//text: "Time slot test",
			title: "This is a test to see if i can use markers to highlight time slots",
		});

It works, but even with a z-index = 0, it still renders on top of tasks, but i want them behind the tasks.

Then i found out that if i move the div gantt_marker_area manually in the DOM, before the div gantt_bars_area, it works, the marker is behind the tasks

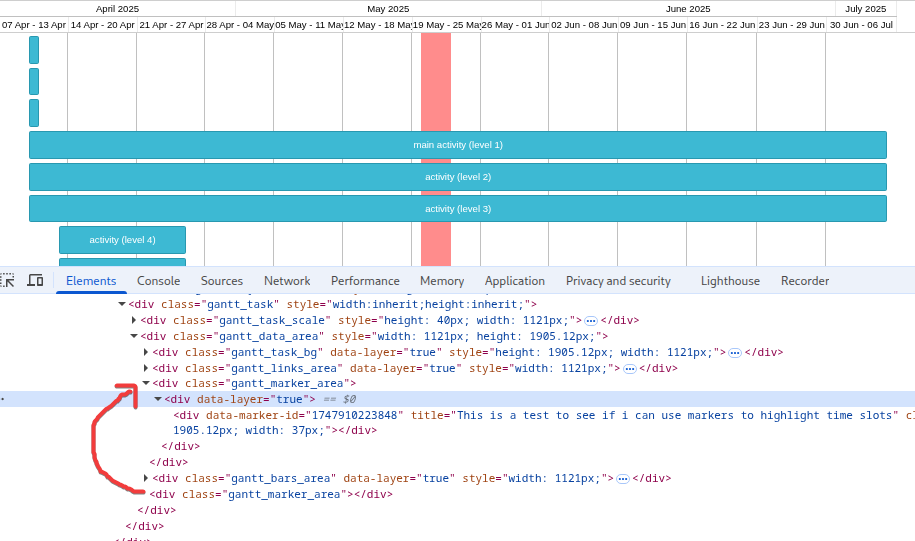
My question is , is there a clean way to do what i want, instead of all these tricks :slight_smile:

Hello,
Modifying the DOM structure in Gantt is not recommended. When Gantt repaints the data, it removes the existing HTML elements and creates new ones. So, any changes you added will be lost next time Gantt repaints the data. This doesn’t happen to the markers and some timeline nodes when you drag tasks, but it should happen after the init and resetLayout methods.

The timeline_cell_class template only returns a custom class name for the timeline cell. By using it as a selector, you can add the styles you need. If you only have the day scale, the cells don’t have any information about the hour settings as they are not displayed. And a week scale cell doesn’t have any information about the weekends. So, the expected approach would be to add the lower scale. Then you can modify the min_column_width parameter to decrease the width of the lowest cells:
https://docs.dhtmlx.com/gantt/api__gantt_min_column_width_config.html

You can check how it works in the following snippet:
https://snippet.dhtmlx.com/1t9e7z50

If you don’t want to add the hour scale, you need to implement a custom solution to highlight hours. It is not recommended to use markers as they are rendered even when they are outside the viewport, so, it affects performance.
Instead of that, you can use the addTaskLayer method that allows displaying any HTML elements in the timeline:
https://docs.dhtmlx.com/gantt/api__gantt_addtasklayer.html

By default, the additional layer elements are displayed below the task bars. But it can be customized if you want.

Here is an example of how it can be implemented:

@Joker I think the easiest solution that does not require a lot of coding and is reasonably safe in terms of side effect is to set z-index:0 for custom markers and z-index:1 for tasks, links, and (if you use them) for constraints/baselines/deadlines.

	.gantt_task_line, 
	.gantt_task_link > div {
		z-index: 1;
	}
	.gantt_task_link:hover>div {
		z-index: 2; /* when you mouse over a link - it should be displayed on top of other links */
	}
	.custom-timeslot{
		opacity: 0.5;
		background: cornsilk;
		z-index: 0;
	}

demo:
https://snippet.dhtmlx.com/cypnpev4

1 Like