Conditional Templates

Hi, I have two dataviews on a page and each dataview could have 2 different templates based on a database value for an image name. If the image is null then I want to show an add button with some information, if there is an image name in the database then I would like to show a template that has a resize and delete button next to the image.

Is it possible to conditionally load templates based on a database value?

Thanks.

Yes, it possible.
Most samples are using html-like samples, which are fine for simple logic. But if you have a more complex logic you can use js function to define it

Check
dhtmlxDataView\samples\02_templates\02_js.html

template:function(obj){ return (obj.Package||"").substr(0,10)+""+(obj.Version||"").substr(0,3)+" <br/>"+obj.Maintainer; }

Inside template function you can define any kind of logic

template:function(obj){ if (obj.image) return "some"; else return "other"; }

I want to set the width of the line to 0 in Line chat if the data is 0.
My code:
var data = [
{ “A”:“15.9”, “B”:21, “C”:31,year:“1” },
{ “A”:“13.8”, “B”:23, “C”:32, year:“2” },
{ “A”:“13.4”, “B”:23, “C”:33, year:“3” },
{ “A”:“14.1”, “B”:23, “C”:33, year:“4” },
{ “A”:“14.3”, “B”:24, “C”:34, year:“5” },
{ “A”:“15.9”, “B”:25, “C”:35, year:“6” },
{ “A”:“16.1”, “B”:27, “C”:36, year:“7” },
{ “A”:“16.5”, “B”:23, “C”:34, year:“8” },
{ “A”:“15.2”, “B”:25, “C”:33, year:“9” },
{ “A”:“14.8”, “B”:26, “C”:32, year:“10” },
];

window.onload = function(){
	var chart1 =  new dhtmlXChart({
		view:"spline",
		container:"chart1",
    	value:"#A#",
		item:{
			borderColor: "#3399ff",
			color: "#ffffff"
		},
		line:{
			color:"#3399ff",
			width:3
		},
		xAxis:{
			template:"#year#",
			lines:true,
			title:'Age (Years)'
		},
		yAxis:{
			start:12,
			step:1,
			end:38,
			lines:true,
			title:'BMI'
		},
		padding:{
			left:50,
			bottom:40
		},
		origin:0,
	})
	

	chart1.addSeries({
		value:"#B#",
		item:{
			borderColor: "#66cc00",
			color: "#ffffff"
		},
		line:{
			color:"#66cc00",
			width:3
		}
	})
	chart1.addSeries({
		value:"#C#",
		item:{
			borderColor: "#66cc00",
			color: "#ffffff"
		},
		line:{
			color:"#66cc00",
			width:3
		}
	})
	chart1.parse(data,"json");
}

Is it possible???
Hello,

there is no way to set item width. You need to exclude the 0 item before data are loaded into a chart

Hi,

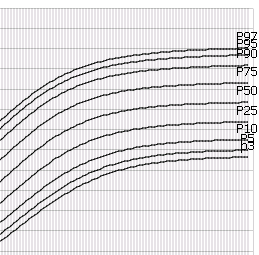
Can we align the label text in Line chart?

I plotted 10 curves on a chart.
I have many data. So I set label only for the last point by using the condition

label:function(obj){
if(obj.data0==37)
return ‘P3’;
else
return “”;
}
here, 37 is the maximum x-scale value.
I need to align the label text. Please do help.

Hi,

how do you want to align labels?

The last labels are up now. I need to bring them down and little bit left side.

Loading from CSV

var data = [
{ “A”:"-1.9", “B”:1, “C”:1,year:“2000” },
{ “A”:"-0.8", “B”:0.8, “C”:2, year:“2001” },
{ “A”:“3.4”, “B”:1.9, “C”:3, year:“2002” },
{ “A”:“4.1”, “B”:2.5, “C”:3, year:“2003” },
{ “A”:“4.3”, “B”:3.1, “C”:4, year:“2004” },
{ “A”:“5.9”, “B”:4.5, “C”:5, year:“2005” },
{ “A”:“6.1”, “B”:5.7, “C”:6, year:“2006” },
{ “A”:“6.5”, “B”:7.2, “C”:4, year:“2007” },
{ “A”:“5.2”, “B”:6.5, “C”:3, year:“2008” },
{ “A”:“4.8”, “B”:6.8, “C”:2, year:“2009” }
];
Now we get 3 curves by using addseries() function
I want to add 4th curve D with data such as first two data has value, other eight are empty. E.g {2,3,’’,’’,’’,’’,’’,’’,’’,’’}.

Is it possible?
Please do help

The last labels are up now. I need to bring them down and little bit left side.

you may set template for labels. For example if labels represent “year” property, you may use the following:

label:function(obj){
return “

”+obj.year+"
";
},

I want to add 4th curve D with data such as first two data has value, other eight are empty. E.g {2,3,’’,’’,’’,’’,’’,’’,’’,’’}.

Please check the post viewtopic.php?f=8&t=16292 Possibly it’ll help

Thanks Alexandra,