Hi,
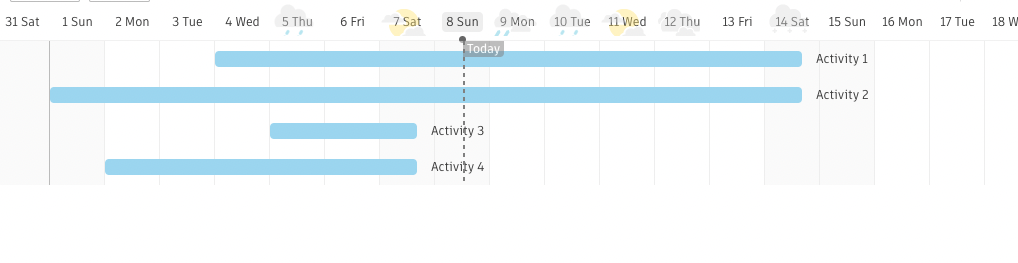
You can add any data to the scale cell using the format attribute in the gantt.config.scales configuration object.
For example, I used the weather object:
const weather = [
    { date: "02-04-2023", precipitationType: "fa-solid fa-cloud-sun",           temperature: "15" },
    { date: "03-04-2023", precipitationType: "fa-solid fa-cloud-showers-heavy", temperature: "10" },
    { date: "04-04-2023", precipitationType: "fa-solid fa-cloud-rain",          temperature: "13" },
    { date: "05-04-2023", precipitationType: "fa-solid fa-cloud-meatball",      temperature: "8" },
    { date: "06-04-2023", precipitationType: "fa-solid fa-cloud-bolt",          temperature: "5" },
    { date: "07-04-2023", precipitationType: "fa-solid fa-cloud-sun",           temperature: "15" },
    { date: "08-04-2023", precipitationType: "fa-solid fa-cloud-showers-heavy", temperature: "10" },
    { date: "09-04-2023", precipitationType: "fa-solid fa-cloud-rain",          temperature: "13" },
    { date: "10-04-2023", precipitationType: "fa-solid fa-cloud-meatball",      temperature: "8" },
    { date: "11-04-2023", precipitationType: "fa-solid fa-cloud-bolt",          temperature: "5" },
    { date: "12-04-2023", precipitationType: "fa-solid fa-cloud-sun",           temperature: "15" },
    { date: "13-04-2023", precipitationType: "fa-solid fa-cloud-showers-heavy", temperature: "10" },
]
Scale configuration:
const dateFormat = gantt.date.date_to_str("%d-%m-%Y");
const dateFormatScale = gantt.date.date_to_str("%d %D");

gantt.config.scales = [
    { unit: "day", step:1, format: (date) => {
        const dayForecast = weather.find(item => item.date == dateFormat(date));
        if (dayForecast) {
            return `<i class='${dayForecast.precipitationType}'></i> ${dayForecast.temperature}°C<br/>${dateFormatScale(date)}`;
        }
    }}
]
Styles:
<style>
    body,
    html {
        width: 100%;
        height: 100%;
        margin: unset;
    }

    .gantt_container .gantt_grid_scale .gantt_grid_head_cell {
        line-height: 43px;
    }

    .gantt_container .gantt_scale_cell {
        padding-top: 4px;
        line-height: 17px;
    }
</style>
Icons taken from here:
<script src="https://kit.fontawesome.com/7bc4fb1ca9.js" crossorigin="anonymous"></script>
Please see an example: https://snippet.dhtmlx.com/itjt4qzn