Hello.
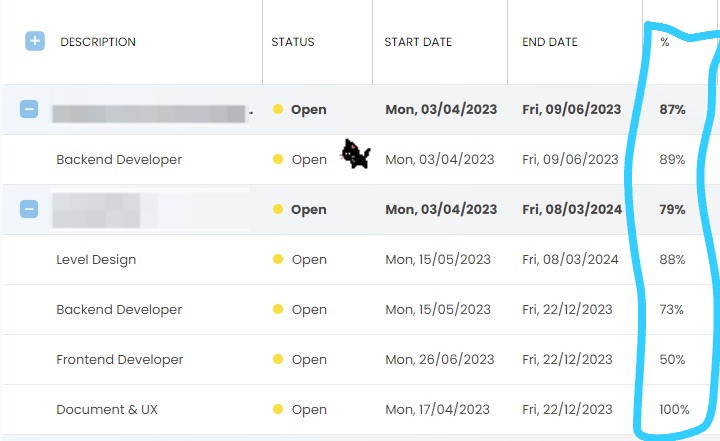
How to custom CSS column progress in gantt cell?
     gantt.templates.grid_cell_class = function(task, date, columnName) {
            if (columnName === "progress") {
                let progress = Math.round(task.progress);

                if (progress >= 0 && progress <= 20) {
                    return "progress-red";
                } else if (progress > 20 && progress <= 60) {
                    return "progress-orange";
                } else if (progress > 60 && progress < 90) {
                    return "progress-blue";
                } else if (progress >= 90) {
                    return "progress-green";
                }
            }
            return "";
        };```

i used this but didnt work
.gantt_row .gantt_cell[data-column-name=‘progress’].progress-red {
background-color: #ffcccc;
color: black;
}
.gantt_row .gantt_cell[data-column-name=‘progress’].progress-orange {
background-color: #ffebcc;
color: black;
}
.gantt_row .gantt_cell[data-column-name=‘progress’].progress-blue {
background-color: #cce5ff;
color: black;
}
.gantt_row .gantt_cell[data-column-name=‘progress’].progress-green {
background-color: #d4edda;
color: black;
}
Hello,
You can achieve this with the grid_row_class template:
gantt.templates.grid_row_class = (start, end, task) => {
	return 'progress';
};
CSS:
.progress .gantt_cell:nth-child(4) {
    background: blue !important;
    color: red;
}
Here is an example: DHTMLX Snippet Tool
1 Like