- How many columns can the list on the left side of the Gantt chart show? What are the fixed column names? Can I add a lot of custom column names? How many columns can be added at most? How to increase?
- Does it support overall zoom in and out? Is drag and drop supported?
- Whether columns can be fixed on the left side of the Gantt chart. At the same time, can the column head of fixed column display be replaced?
- Does the task display style color support modification? How to modify?
- How to allocate resources? How can I support the addition of avatars? How to increase?
Hello,
First of all, there are 2 different Gantt versions: Javascript Gantt and Vue.js Gantt. Both of them are completely different components. The Javascript version has a lot more features than the Vue.js version.
How many columns can the list on the left side of the Gantt chart show?
Can I add a lot of custom column names? How many columns can be added at most? How to increase?
The number of columns is not limited.
In the Javascript version, you can add the horizontal scrollbar for the grid in the layout configuration to see the columns that don’t fit the specified sizes:
https://docs.dhtmlx.com/gantt/desktop__layout_config.html#scrollbar
To add more columns, you will need to modify the gantt.config.columns parameter:
https://docs.dhtmlx.com/gantt/desktop__specifying_columns.html
Here is an example:
http://snippet.dhtmlx.com/5/0cedc4d29
In the Vue.js version, you need to add the overflow: auto style rule to the grid element to scroll it:
https://snipboard.io/8wq51C.jpg
The columns can be specified in the columns property:
https://snipboard.io/kVtNPA.jpg
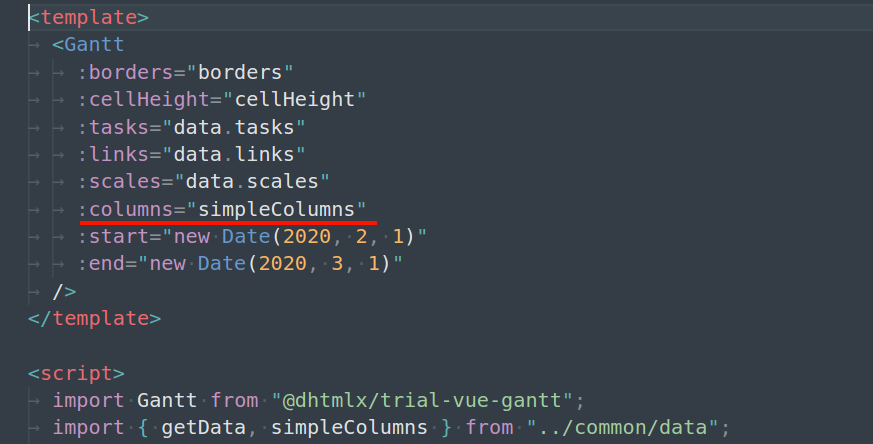
What are the fixed column names?
There are no fixed columns that should always be displayed. You define the column configuration and specify which columns should be displayed.
Does it support overall zoom in and out?
The Javascript version allows changing the scale settings in the timeline. You can do that manually or with the zoom module:
https://docs.dhtmlx.com/gantt/desktop__configuring_time_scale.html
https://docs.dhtmlx.com/gantt/desktop__zooming.html
Here are examples:
https://docs.dhtmlx.com/gantt/samples/03_scales/05_dynamic_scales.htm
https://docs.dhtmlx.com/gantt/samples/03_scales/13_zoom_to_fit.html
https://docs.dhtmlx.com/gantt/samples/03_scales/14_scale_zoom_by_wheelmouse.html
The Vue.js version doesn’t have that feature.
If you need something different, please, describe that question in more detail.
Is drag and drop supported?
You can horizontally move and resize tasks in the timeline in both versions.
The feature that allows vertically reordering tasks in the grid is available only in the Javascript version:
https://docs.dhtmlx.com/gantt/desktop__reordering_tasks.html
Here are examples:
https://docs.dhtmlx.com/gantt/samples/07_grid/02_branch_ordering.html
https://docs.dhtmlx.com/gantt/samples/07_grid/14_branch_ordering_highlight.html
If you need something different, please, describe that question in more detail.
Whether columns can be fixed on the left side of the Gantt chart.
In the Javascript version, you can do that, if you add 2 grid views in the layout configuration:
https://docs.dhtmlx.com/gantt/desktop__layout_config.html#layoutcustomization
Here are examples:
http://snippet.dhtmlx.com/d6be1467a
http://snippet.dhtmlx.com/0e95aa933
http://snippet.dhtmlx.com/5/2c07e9730
However, inline editors expect to work only in one grid. It will be fixed in the future, but I cannot give you any ETA.
The Vue.js version doesn’t have that feature.
At the same time, can the column head of fixed column display be replaced?
In the Javascript version, you can show any text or HTML elements in a column by adding them in the label property in the column configuration:
http://snippet.dhtmlx.com/5/8aaecb963
In the Vue.js version, you can only return custom text.
Does the task display style color support modification? How to modify?
In the Javascript version, there are several ways of how to customize the colors:
https://docs.dhtmlx.com/gantt/desktop__colouring_tasks.html
Here are examples:
https://docs.dhtmlx.com/gantt/samples/04_customization/04_task_styles.html
http://snippet.dhtmlx.com/38c031774
http://snippet.dhtmlx.com/5/b62285d9a
https://snippet.dhtmlx.com/5/3b74c0541
In the Vue.js version, you need to do that with the style rules:
https://snipboard.io/gsNDrx.jpg
How to allocate resources?
In the Javascript version, Gantt can help you to display the resource allocation, but it doesn’t have the built-in logic to allocate resources. You will need to manually implement that logic.
You can read more about that feature in the following article:
https://docs.dhtmlx.com/gantt/desktop__resource_management.html
Here are examples:
https://docs.dhtmlx.com/gantt/samples/11_resources/
The Vue.js version doesn’t have the feature to display resources.
How can I support the addition of avatars? How to increase?
In the Javascript version, you can add any text or HTML elements inside the grid columns and over the task elements in the timeline.
For the grid columns, you need to use the template function in the column configuration:
https://docs.dhtmlx.com/gantt/desktop__specifying_columns.html#datamappingandtemplates
For the task elements in the timeline, you need to use the task_text template:
https://docs.dhtmlx.com/gantt/api__gantt_task_text_template.html
Here is an example:
http://snippet.dhtmlx.com/5/6cd5c1fc9
For the Vue.js version, you can customize the template to change what is displayed inside the task bar element in the timeline:
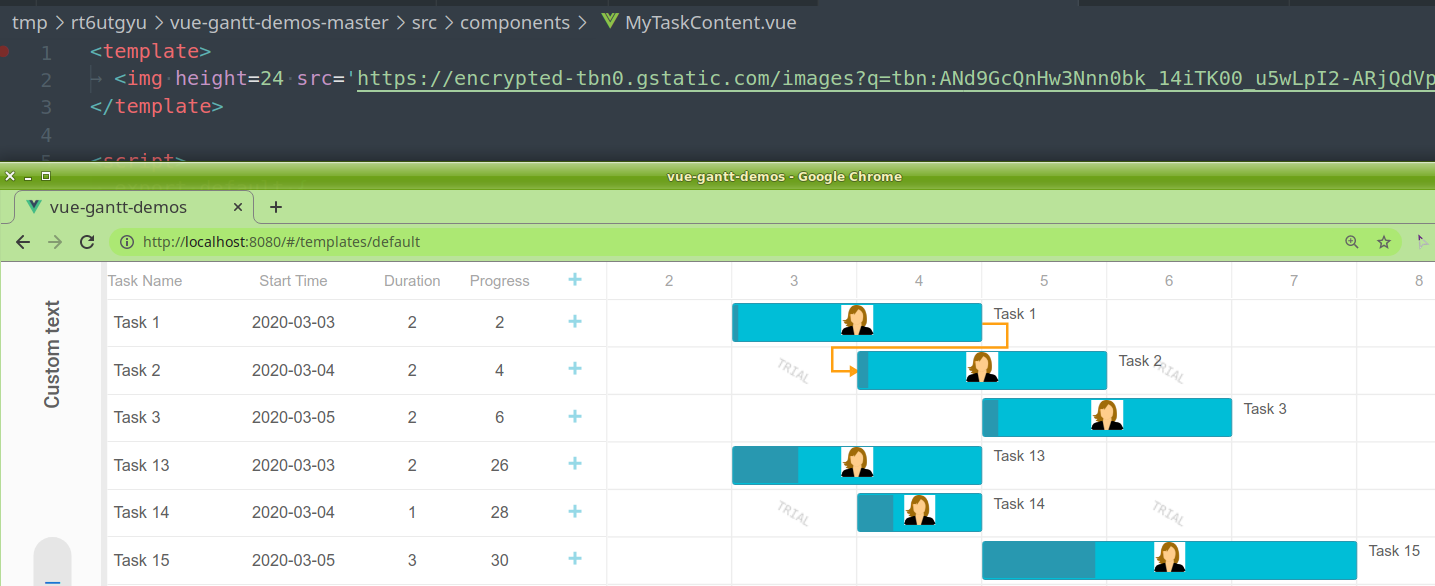