First of all, congratulations for this component. I did not imagine that was possible draw on canvas directly through Javascript.
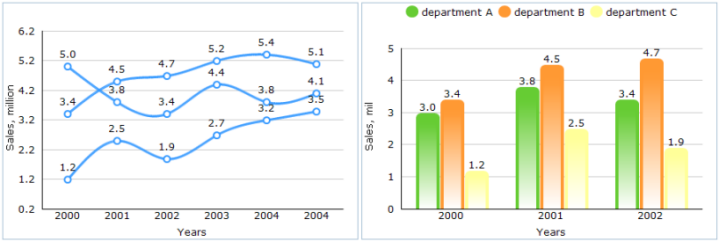
My question is about grouped bar charts. How can I see on documentations, it’s not supported yet. Is there any plans to support this kind of graph or there is another way to do it?
Alexandra,
Thanks, that looks great. I can’t wait to try it. The example shows the same color for the lines on the line chart, for different series, can you make them each a different color?
Alexandra
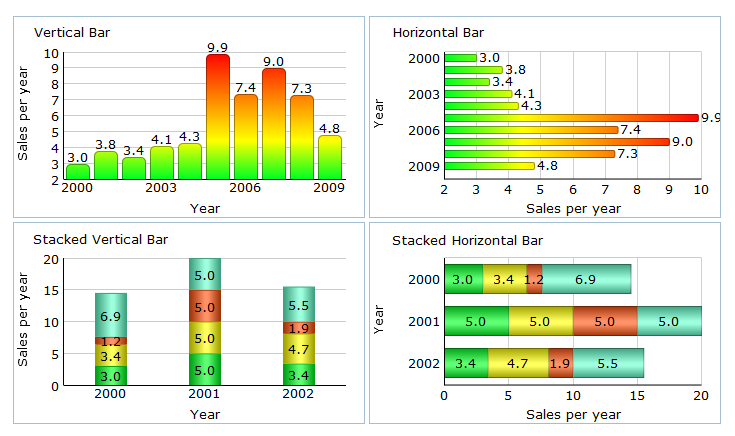
Do you have graphics illustrating the proposed “stacked” bar and column charts? My previous query on availability was also proposed for September!
Regards
Hi, please can you confirm the date of release for the new functionality for the charts descibed above i.e. multiple lines on ‘line’ chart. it was said to be September, do you have any update on this?
There are some technical issues with release, they not related to component, final version of which is ready. You can contact us directly at the support@dhtmlx.com if you need it ASAP
As for official release date, It will be in next few days ( most probably in first part of next week )
Get a guaranteed answer from DHTMLX technical support team
under the most suitable support plan