Hello,
Does the chart part of dhtmlx require you to use
window.onload = function()  {
chart config, and dataparsing }
Because I can’t seem to get it to work without this? Not even with jQuery document.ready…
Hello,
Does the chart part of dhtmlx require you to use
window.onload = function() {
chart config, and dataparsing }
Because I can’t seem to get it to work without this? Not even with jQuery document.ready…
Hello
As you can see, all our samples provide such approach:
dhtmlx.com/docs/products/dht … alization/
Need to specify: what do you exactly want (expect)?
I want to know if the dhtmlx suite require this behavior?
If yes, why can’t you use $(document).ready instead? The problem is that I have written code to dynamically make charts based on what data is provided, which means I can’t specify all the charts in the same onload function and therefore they overwrite each other. I can overcome this problem by adding event listeners. But. Now I want to know why these charts require the unload function???
Charts are using onload handler to be sure that chart-related css is loaded ( it is critical for text label rendering, css defines fonts and sizes, which need to be taken in account to place text correctly )
You can use any other solution, I think jQuery document.ready will work as well.
( even if you init chart without waiting for document ready - it will render mostly correct, only positions of labels can be non-perfect )
why can’t you use $(document).ready instead
Because we are not using jQuery.
Components has not any external dependencies, you can use it with any other js lib, or without any extra lib.
I can’t specify all the charts in the same onload function and therefore they overwrite each other
You can use
dhtmlxEvent(window, "load", function(){
     ... init code here...
});
You can have many of such code blocks on the page, they will not overwrite each other.
Thank you Stanislav. This works.
I have another question. Is it correct you do not have a build in way to this:
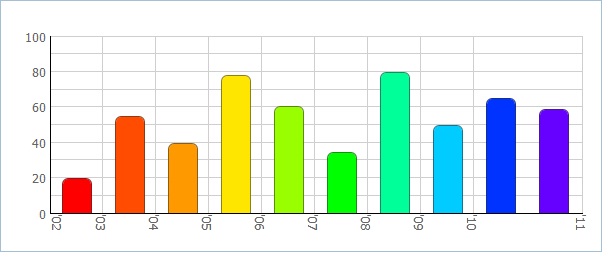
If so, and I have to do it with CSS. Do you know of any way to adjust the padding-buttom on the charts, to avoid this:
cloudho.st/i/IcMbpysC.png
You just need to apply the next CSS rule:
.dhx_canvas_text.dhx_axis_item_x{
                display: block;
                writing-mode: tb-rl;
                -webkit-transform: rotate(90deg);
                -moz-transform: rotate(90deg);
                -ms-transform: rotate(90deg);
                -o-transform: rotate(90deg);
                transform: rotate(90deg);
            }
If you need some rptating on Y - just replace X with Y:
[code].dhx_canvas_text.dhx_axis_item_y{...)Result:

That was what I did before. And it does not solve my problem unfortunately.
As a side information I can say that the chart is attached to one of your dhtmlx layout.
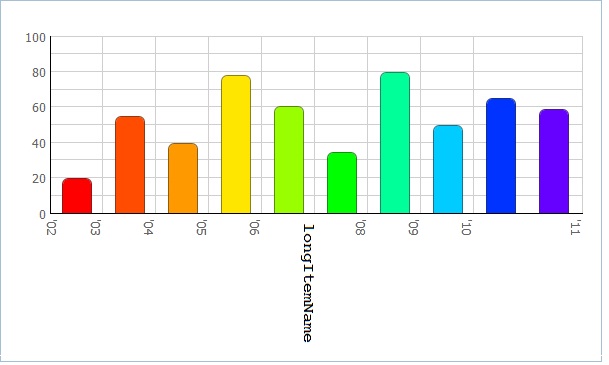
Need to identify: do you want spmething loke this?

Yes, that is somewhat that i’m looking for.
Use the property ‘padding’ and rotate item label as i’ve mentioned before.
docs.dhtmlx.com/doku.php?id=dhtm … barpadding