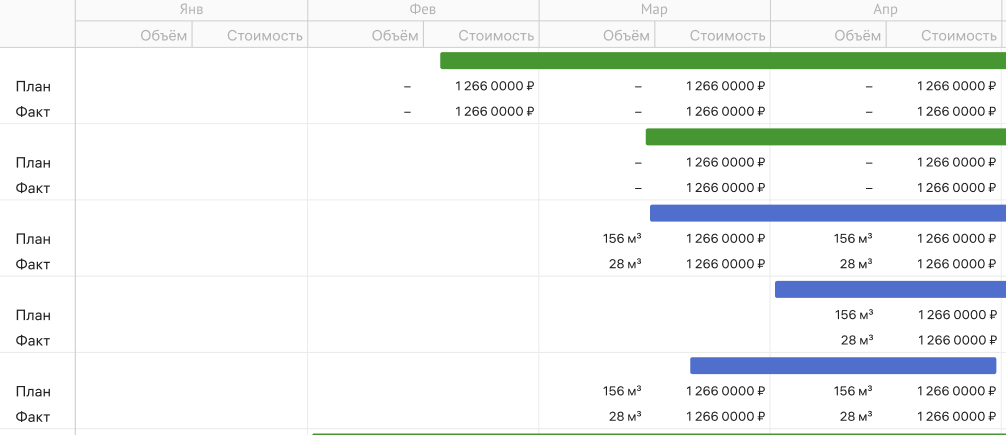
I want to display additional information on a chart, like in this screenshot, how can I do this?
Hello,
You can implement it with the help of Gantt API and JS. If you want to have custom scale with some info, you need to use gantt.config.scales with a custom unit:
scales Gantt Docs ;
You can use timeline_cell_content template to display additional information to the timeline area:
timeline_cell_content Gantt Docs ;
Please check the example of how it might be implemented:
Thanks for the answer, but unfortunately this solution does not suit me, because I have version 7.1 PRO, I cannot use the timeline_cell_content method.
I’m trying to use the addTaskLayer method to add a layer, calculate the position and output the value, it looks similar, but of course it’s not what I wanted, it adds a lot of side calculations. Perhaps there is a way to implement the timeline_cell_content method on my version?
Also in scales I simply added a new object with the layout I needed
    {
      step: 1,
      template: () => '<div class="indicatorsGanttHeader"><div>info</div><div>money</div></div>',
    },
Hello,
Perhaps there is a way to implement the timeline_cell_content method on my version?
Unfortunately, it is not possible to implement this functionality in your current version without introducing potential regressions and bugs. I cannot recommend an alternative approach. Therefore, if you need to use the timeline_cell_content template, it is advisable to update your Gantt version.
