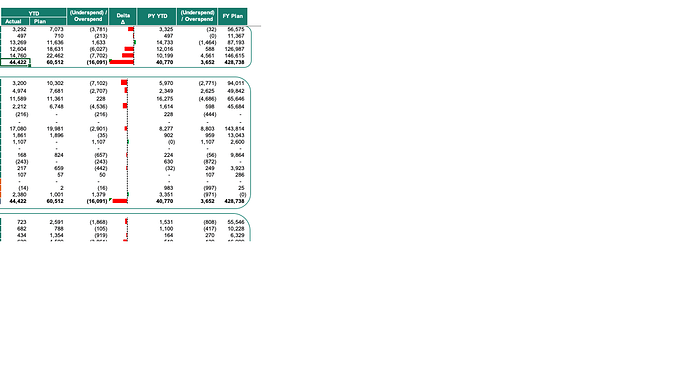
My requirement is to draw a chart in a DHTMLXGrid Column. Is there any option to build our custom graphs into DHTMLXGrid column?
For the dhtmlxGrid 5 you are able to create a custom column type with any required logic and html-content.
Here you can find a tutorial about creating a custom column type with some simple examples:
https://docs.dhtmlx.com/grid__columns_types.html#customcolumntypes
