Hi
I have a problem of similar kind, I want to create a bar chart of series type, (3 bar’s similar to the example given here dhtmlx.com/docs/products/dhtmlxC … eries.html),
but I want to load the data using jsarray instead of using json.
I tried to declare the array as below:
var data = [
[100, 125, 245, 147, 67],
[85, 156, 179, 211, 123],
[97, 87, 56, 267, 157]
];
var myBarChart;
function doOnLoad() {
myBarChart = new dhtmlXChart({
view:"bar",
container:"chart1",
value:"#data1#",
color: "#58dccd",
gradient:"rising",
tooltip:{
template:"#data1#"
},
width:60,
xAxis:{
template:function(item){
return item.$unit;
},
value:function(item){
return item.year;
},
units:{
start:2000,
end:2004,
next:function(value){
return value+1;
}
}
},
yAxis:{
start:0,
step:10,
end:100
},
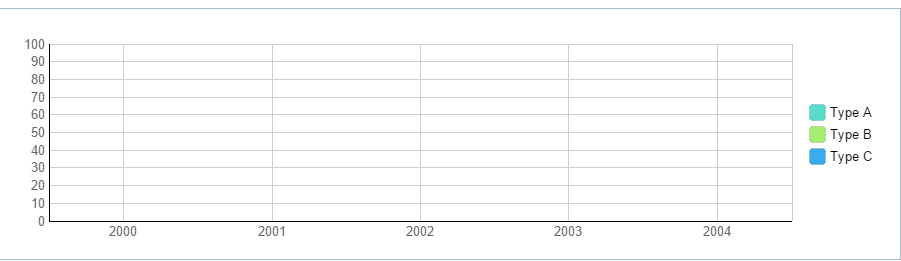
legend:{
values:[{text:"Type A",color:"#58dccd"},{text:"Type B",color:"#a7ee70"},{text:"Type C",color:"#36abee"}],
valign:"middle",
align:"right",
width:90,
layout:"y"
}
});
myBarChart.addSeries({
value:"#data2#",
color:"#a7ee70",
tooltip:{
template:"#data2#"
}
});
myBarChart.addSeries({
value:"#data3#",
color:"#36abee",
tooltip:{
template:"#data3#"
}
});
myBarChart.parse(data,"jsarray");
}
the x and y-axis are displayed but the values are not being plotted.
can anyone help in using jsarray for this chart?