Dynamic series in charts

Hi,
I want to create a bar chart as shown in the attachment.


The problem is that I can have different number of series for different months. Is there any ways to add the series at the time of chart creation based on the data the chart gets?
Also, The maximum number of series is too large for me to manually add ( around 700) and the user can change it at any time.

Hi
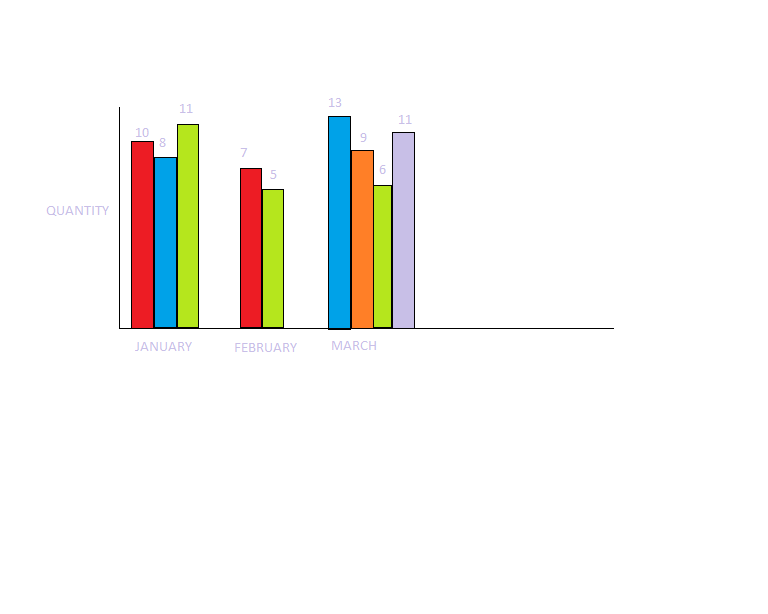
There is no such dynamic feature: i.e. ig chart gets ‘0’ item for some series, there will no bar but will an empty place for it.
You just have to redraw chart every time you need to rebuild it.

Hi,
I tried using something like this

http://www.dhtmlx.com/docs/products/dhtmlxChart/samples/06_bar_chart/12_custom_axis.html

It i working but i have one concern. when i have two records of the same date, one of them gets overwritten. is there any way to avoid that?

In this case you need to try to group it someway, because if there 2 or more items for the one data - the last one will redraw all the previous.