husky
February 24, 2015, 12:32pm
#1
Hi,
I’m trying to filter results from a dhtmlxChart that gets his data from a dhtmlxGrid.
Same like this post:viewtopic.php?f=8&t=29642
I’m using example:
function refresh_chart(){
to:
function refresh_chart(){
However this is not working.
Even when I try the following
barChart.filter(function(obj){
Nothing happens.
Darya
February 26, 2015, 2:18pm
#2
Hi
husky
February 26, 2015, 2:59pm
#3
Sweet it works again!
The method .render() is not in your api overviewdocs.dhtmlx.com/api__refs__dhtmlxchart.html
Thank you for the support!
Darya
March 2, 2015, 11:00am
#4
You are welcome!
P.S. Thanx, we will update docs ASAP
Darya
June 10, 2015, 8:57am
#6
Hello
Hello!
	myChart = new dhtmlXChart({
		view:"donut",
		container:"chart_container",
		value:"#data01#",
		color:"#b9a8f9",
		template: "#data01#"
		}
	);
	myChart.parse(myGrid2,"dhtmlxgrid");
the DIV fit as follows…
<div id="yesterdayTab">
	<div id="gridbox4" style="width:100%;height:350px;overflow:hidden"></div>
</div>

<div id="lastWeekTab">
	<div id="gridbox5" style="width:100%;height:350px;overflow:hidden"></div>
	<div id="chart_container" style="width:100%;height:250px;border:1px solid #A4BED4"></div>
</div>
Darya
November 4, 2015, 3:59pm
#8
Need to specify: where myGrid2 is placed in? In “gridbox4” or “gridbox5”?
Thanks Darya!
//Generates the LastWeek table
//pieChart#data01 #",#b9a8f9 ",#data1 #”
and here’s the DIV stuff…
<div id="lastWeekBillablesTab">
	<div id="gridbox5" style="width:100%;height:350px;overflow:hidden"></div>
	<div id="chart_container" style="width:100%;height:250px;border:1px solid #A4BED4"></div>
</div>
Thanks
Darya
November 6, 2015, 1:35pm
#10
Here is a sample “Init tabbar from html”dhtmlx.com/docs/products/dhtmlxT … _html.html dhtmlx.com/docs/products/dhtmlxC … xgrid.html
[code]
DHTMLX test
html,body { width: 100%; height: 100%; margin: 0; }
[/code]
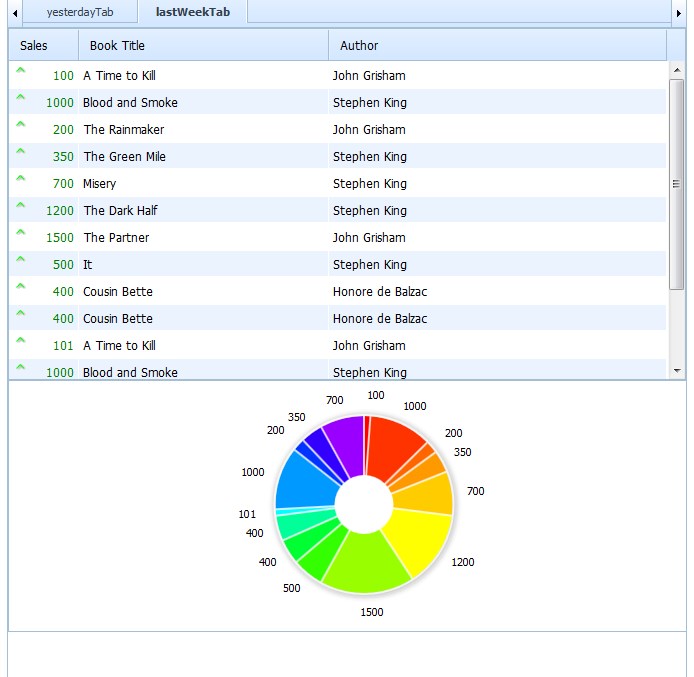
There is one important moment you missed: if you build tabbar from HTML, don't forget to add class="dhtmlxTabBar" property to your tabbar div.
The result is on the picture: