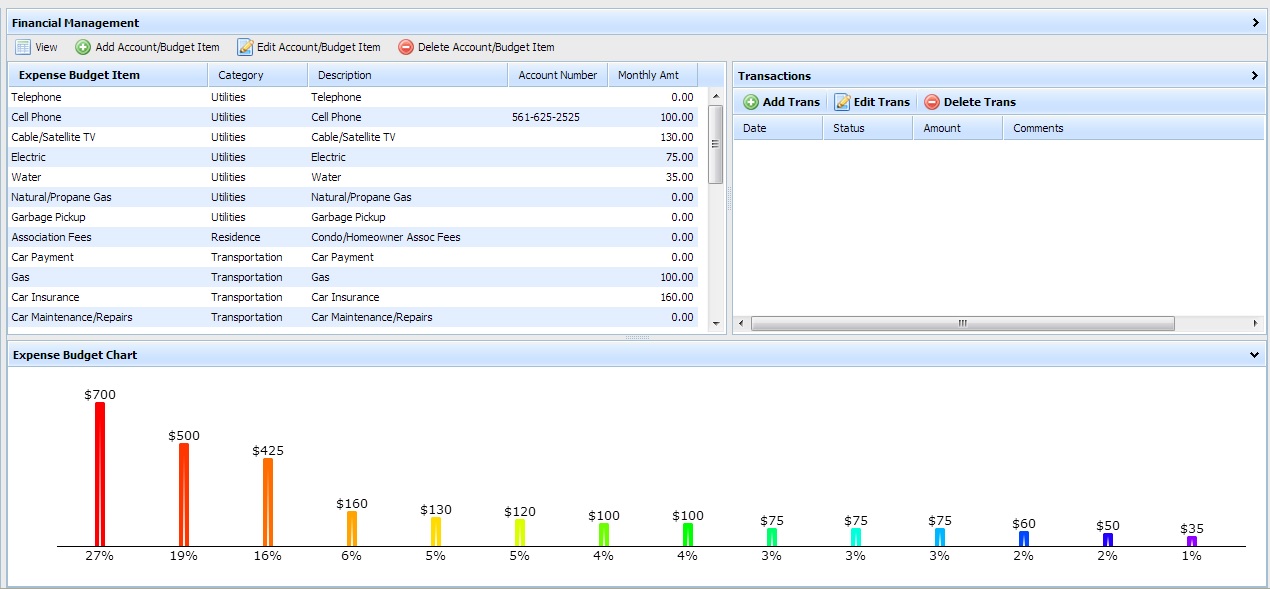
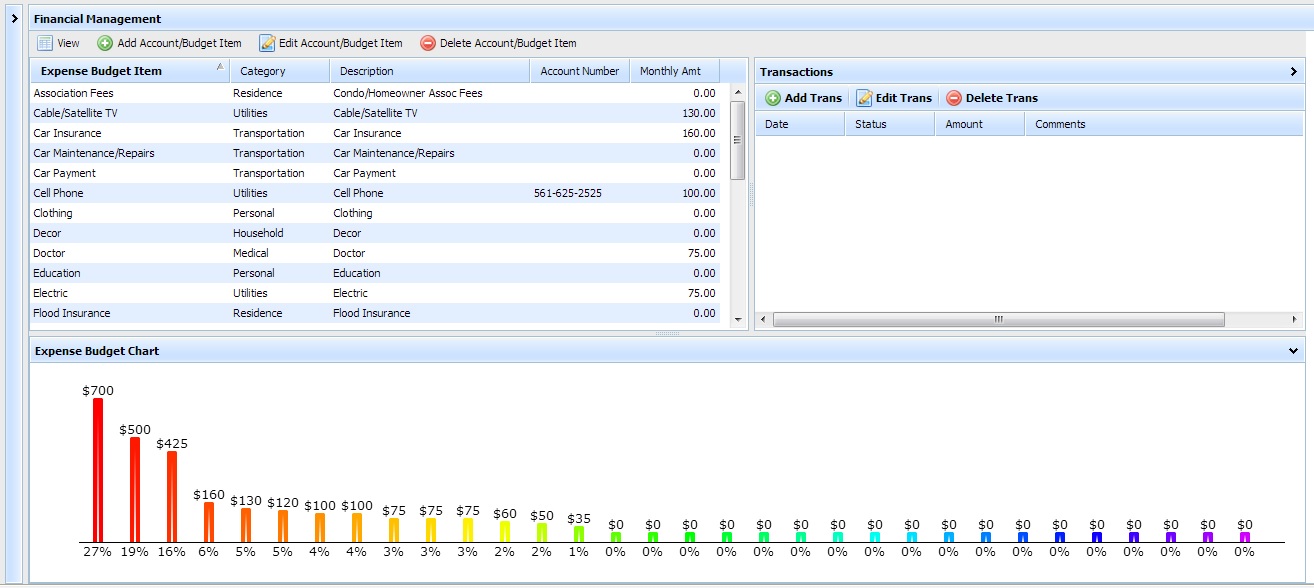
I wonder what the method would be for filtering grid data before passing to chart which is setup via attachChart, without filtering the grid.
There isn’t a configuration property for filter in chart, just a filter method requiring a chart instance.
I’m using a layout with menu driven views for one of the cells which changes the setActive grid, and also changes the chart to go with it.
So rather than use
Chart.parse(currentgrid,“dhtmlxgrid”)
I would like to use
Chart.parse(FILTEREDDATAcurrentgrid,“dhtmlxgrid”)
I want the filter to only include rows where the monthly amount’s column value is greater than 0
Any ideas?
[code]//THIS IS THE CODE ATTACHING THE CHART TO A CELL IN THE LAYOUT
FinMgmtChart = FinMgmtLayout.cells(“c”).attachChart({
view:“bar”, //sets chart’s type. In our case it’s vertical bar
gradient: true, //gives us gradient shades
//container:“SpendByCatByMonth”, //html div for chart, we’re using attach to cell instead
value: //“#data4#”, //we’re using function instead
function(obj) {
if (obj.data4 == “”) {
var val = 0;
} else {
var val = parseFloat(obj.data4);
}
return val;
},
label: function(obj){
return formatCurrency(obj.data4,true); //format with $
},
tooltip: { //add the account number to tooltip (mouseover)
template:function(obj) {
if (obj.data3 == “”) {
var val = obj.data0;
} else {
var val = obj.data0 + “
Acct # " + obj.data3;
}
return val;
}
},
width:10,
border: false,
xAxis:{
//title: “Liabilities (Debt) Accounts”, //we’re not using a title
template: function(obj) { //calculate %
var sum = FinMgmtChart.sum(”#data4#“);
if (sum == 0) {
return “0%”;
} else {
if (obj.data4 == “”) {
var val = 0;
} else {
var val = parseFloat(obj.data4);
}
var pct = Math.round( val/ sum * 100);
return pct + “%”;
}
},
lines: false
},
sort:{ //sort with highest $ value on left
by:”#data4#",
dir:“desc”,
as:“int”
}
});
//THIS LINE IS IN A FUNCTION WHEN DISPLAYED GRID OR DATA IN GRID CHANGES
FinMgmtChart.parse(currentgrid,“dhtmlxgrid”); //loads new grid data to the chart[/code]