Gantt Chart header not displaying correctly (the days)

Hi all,

I just found this incredible gantt chart and starting playing with it in my javascript class, I tried adding some dummy data and the result was slightly cut off (attached) and the Dates are a month behind? Is January month 0? Everything else went smooth but with the header cut off the scrolling doesn’t work well either. I’m using the chart in an Ext (js framework) Window

Here is my code

var gDom = this.ganttWindow.body.dom;
				
				// Initialize Gantt data structures
				var project = new GanttProjectInfo(1, "My Chart", new Date(2011, 3, 1));
				var pTask = new GanttTaskInfo(20, "Create Gantt Chart", new Date(2011, 3, 2), 120, 30, "");
				pTask.addChildTask(new GanttTaskInfo(21, "Fill with data", new Date(2011, 3, 2), 5, 80, ""));
				pTask.addChildTask(new GanttTaskInfo(22, "Implement dependencies", new Date(2011, 3, 3), 24, 10, ""));
				project.addTask(pTask);
				var pTask2 = new GanttTaskInfo(30, "Web service comm", new Date(2011, 3, 4), 72, 10, "");
				pTask2.addChildTask(new GanttTaskInfo(31, "Write web service", new Date(2011, 3, 4), 2, 70, ""));
				project.addTask(pTask2);
		        
		        // Create Gantt control
		        ganttChartControl = new GanttChart();

		        ganttChartControl.setImagePath("js/codebase/imgs/");
		        ganttChartControl.setStylePath("js/codebase/dhtmlxgantt.css");
		        ganttChartControl.setEditable(false);
		        ganttChartControl.showTreePanel(true);
		        ganttChartControl.showContextMenu(false);
		        ganttChartControl.showDescTask(true,'s-f');
		        ganttChartControl.showDescProject(true,'d');

		        // Load data structure		
		        ganttChartControl.addProject(project);
		        // Build control on the page
		        ganttChartControl.create(gDom);

For those of you who picked up on my DOM element, I had to change the code to pass the element itself since it’s in a window that isn’t defined in my html…

Thank you for the help! I don’t know what to do…
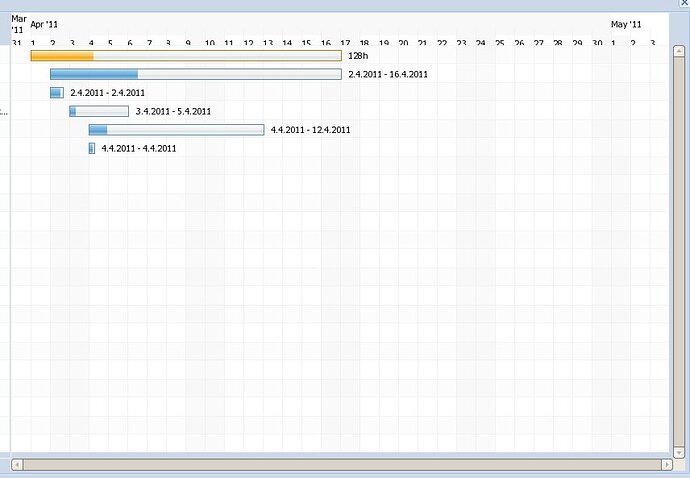

Hi Chris,

You have styling issues which is normally controlled with the css.
dhtmlx Gantt comes with style sheets to correctly display the dynamically created table elements.
If the css control elements can not be matched then you will get mis-alignments and other issues.

Hi Hal, thanks for answering.

I looked at the css briefly, but I didn’t see anything that looked relevant, what should I be changing? The css and imgs are located and available.

.taskPanelBorder{border-width: 2px 2px 2px 2px;border-style:solid;border-color: #737373;}

.taskName{font-family: Tahoma, Arial; font-weight: bold;font-size: 11px;color: #FFFFFF;cursor: pointer;white-space: nowrap;}

.moveInfo{font-family: Tahoma, Arial;font-size: 10px;color:#006600;white-space: nowrap;}

.descTask{font-family: Tahoma, Arial;font-size: 10px;color:#276F9E;cursor: default;white-space: nowrap;}

.descProject{font-family: Tahoma, Arial;font-size: 10px;color:#006600;cursor: default;white-space: nowrap;}

.dayNumber, .monthName{font-family:Tahoma,Arial;font-weight:bold;font-size:9px;color:#858585;text-align:center;vertical-align:middle;}

.monthName {border-top:1px solid #f1f3f1; border-bottom:1px solid #f1f3f1; border-left:1px solid #f1f3f1;text-align:left;padding-left:5px;}

.poPupInfo{background: #FFFFFF;width  : 170px;border: 1px dotted #279e00;padding: 4px 6px 4px 6px;float: left;}

.poPupTime{background: #FFFFFF;border: 1px dotted #279e00;height : 25px;width  : 70px;position: absolute;z-index:2;}

.contextMenu{z-index:10;width:150px;cursor:pointer;font-family: Tahoma, Arial;font-size:12px;color:#7D7D7D;border: 1px solid #808080;}

.taskNameItem{font-family: Tahoma, Arial;font-size: 11px;font-weight: normal;color: #7D7D7D;}

.panelErrors{;padding: 4px 6px 4px 6px;font-family: Tahoma, Arial;font-size: 12px;color: red;white-space: nowrap;}

.st {font-family: Arial, Helvetica, Sans-serif; font-size: 10px; font-weight: normal; color: #688060;}

.ut {font-family: Arial, Helvetica, Sans-serif; font-size: 11px; font-weight: normal; color: #323232;}

.lt {font-family: Arial, Helvetica, Sans-serif; font-size: 11px; font-weight: normal; color: #323232; padding: 0px 0px 0px 14px; margin: 0px; display: block;}

Hi Chris,

You may other styling overwriting the Gantt Chart. When the browser has the Gantt Chart up, can you check the controlling meta data? You can do this by using the F12 Key in IE. Click on the pointer and hightlight the surrounding area around the Gantt Chart. This is normally some sort of DIV. IE will then break down the controlling style for you. This is especially easy with a two monitor system.

cheers

Thanks for helping me out Hal, I’m using firebug and when I found the div elements for the window I saw the table header height was 40px. I increased it to 45 and the table for the task names to 45 and it displays correctly. Isn’t this code from gantt chart? As it’s generating everything…

I can modify it through firebug while debugging but I want to edit it through the css file so it’s proper. Firebug shows the style for the div and it shows (after I changed the height)

element.style {
    height: 45px;
    left: 1px;
    overflow: hidden;
    position: relative;
    top: 0;
    width: 1336px;
}

But it doesn’t give me a location, its generic. Further below it shows the larger portion of the screen inherited config from the js framework css. Any suggestions?

Thanks!