We are evaluating this product to use in our enterprise application.
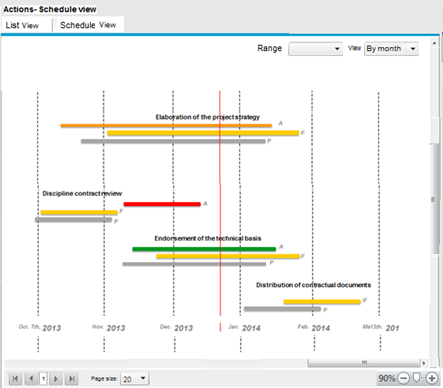
Attached is the visual presentation of requirement.
The main points are as fellow:
Display Gantt View without the Task List.
Allow dynamic scale (Week/Month/Year)
Gantt chart will show Actions. Each Action has Planned Start date/ End Date, Forecast Start date/ End Date, Actual Start date/ End Date. We need to show each action as group. At top will be action name, below it a bar for Planned, Forecast and Actual dates.
Provide paging if data is huge.
Please let us know, if it is possible to achieve the requirement stated above.
Gantt chart will show Actions. Each Action has Planned Start date/ End Date, Forecast Start date/ End Date, Actual Start date/ End Date. We need to show each action as group. At top will be action name, below it a bar for Planned, Forecast and Actual dates.
Task objects can store as many properties as necessary.
Default rendering will not allow such scenario, but it possible to define a custom task rendering template, which will be able to render data in necessary way.
Provide paging if data is huge.
Not available. You can dynamically filter or load data though.
Also check the sample from the next topic, it shows the sample of custom rendering template viewtopic.php?f=15&t=33231
Is it possible to use server side binding of Gantt chart control in ASP.NET?
Official .Net package is not released yet, but you can check the next solution viewtopic.php?f=15&t=32956
Get a guaranteed answer from DHTMLX technical support team
under the most suitable support plan