Hi community!
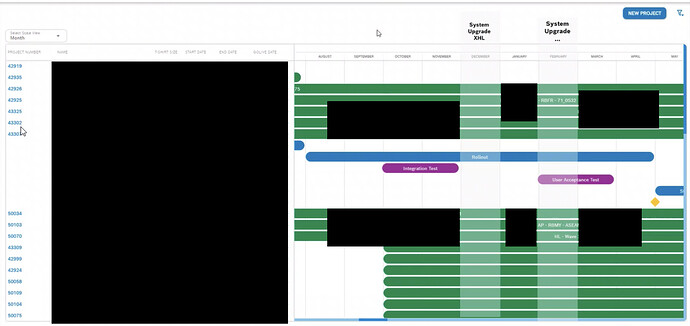
Is that possible to create a marker or banner to display like these two layer over these months?
I already used the code below, as I need to display the title above the scale row.
.technical_marker {
background-color: #000;
font-weight: bold;
font-size: 16px;
width: 15vw;
opacity: 0.5;
}
gantt.templates.marker_class = function(marker){
return “technical_marker”;
}
gantt.attachEvent(“onGanttReady”, function () {
gantt.plugins({
marker: true
});
gantt.addMarker({
  id: "marker1",
  start_date: new Date(2024, 3, 1),
  css: "today",
  text: "System Upgrade - PHL"
});
gantt.addMarker({
  id: "marker2",
  start_date: new Date(2024, 2, 1),
  css: "today",
  text: "System Upgrade - PHL"
});
gantt.render();
});
Thanks in advance!
