Hello,
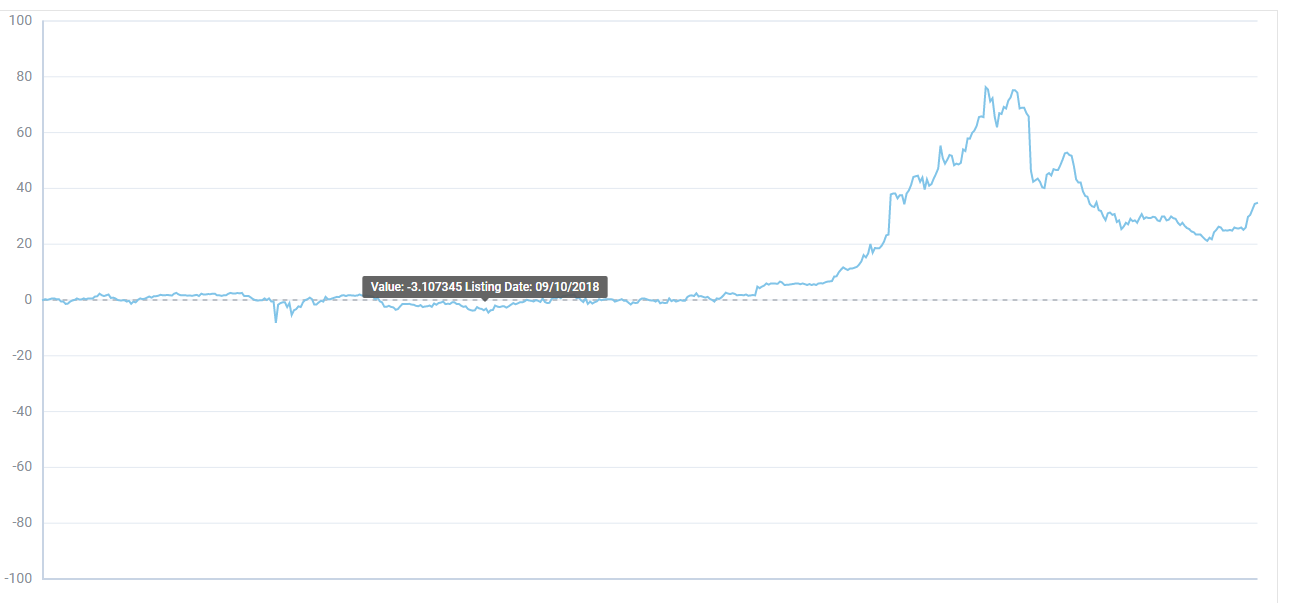
I have a graph with more than 700 dates on the x-axis and I would like to put only the months or the years on it depending on my data period.
I can modify the text but I can’t select only a few.
Is this possible?
Hello,
I have a graph with more than 700 dates on the x-axis and I would like to put only the months or the years on it depending on my data period.
I can modify the text but I can’t select only a few.
Is this possible?
Hello IGM.
I apologize for the delay with the reply.
Ufortunately in this case it is not available to display only the selective values of the x-graph