Newbie here, so be gentle with me.
Trying to put a grid and line chart on a html page.
Followed this guide:
docs.dhtmlx.com/doku.php?id=dhtm … ntegration
Am using a connector to a MySQL database.
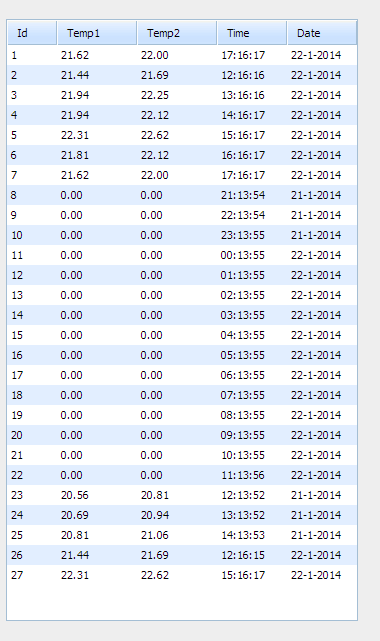
So far the grid table with data is displaying fine. But can’t seem to get a table.
The only image on the page so far is a little bit of the y-axis numbers only.
My problem is that I don’t understand how to use the template function to get the x-axis
set up right. I studied the examples and tried, but no result.
The goal is to show a line chart, with the y-axis the value column ‘Temp1’ and ‘Temp2’ and at the x-axis the column ‘Time’.
Maybe somebody can give a few pointers or examples so that I have a starting pint.
Thanks!
Alfa
(Table grid picture enclosed)
the html code is:
 <script>
    window.onload = function()
 {

   var chart = new dhtmlXChart(
     {
      view: "line",
      origin:0,
      container: "chart1",
      value: "#CDATA#",
      label: "##",
      yAxis:{
             start:0,
             end:50,
             step:5,
             title:"Celsius"
             },
      xAxis:{
             template: "#CDATA#"
             }
    }
                            );

    var mygrid = new dhtmlXGridObject("gridbox1");
    mygrid.setImagePath("codebase/imgs/");
    mygrid.setHeader("Id,Temp1,Temp2,Time,Date");
    mygrid.setInitWidths("50,80,80,70,70");
    mygrid.setColTypes("ro,ro,ro,ro,ro");
    mygrid.setSkin("dhx_skyblue");
    mygrid.init();
    mygrid.loadXML("/scripts/connector.php");

    chart.parse(mygrid,"dhtmlxgrid");


 }
  </script>
The data from the connector.php:
. . . etc