Hey sematik,
DHTMLX avg works as intended. return the average of the sum of column x/row total
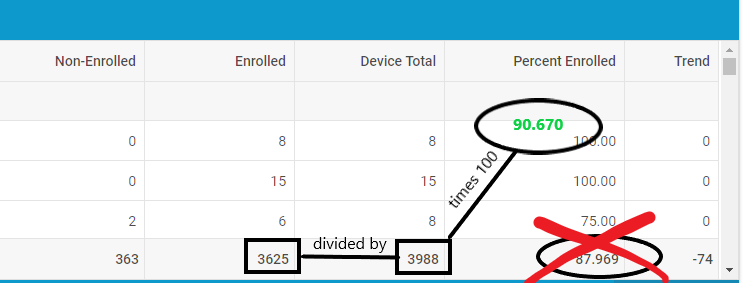
For clarification in this example, there are x unique organizations that have widgets that need to meet a specific compliancy. Each organization’s percentage compliant is calculated on the back end by using (Compliant/Widget Total)*100. So, I need the footer to not average current column but rather a function similar to mark: as demonstrated in the below example you requested.
Is it possible to customize the footer content the same as you can with mark? I could not locate if this was possible. I had the same issue in 5.x but I created a function that returned the percentage of the coumns needed to do so. In this case Column 4 (Compliant) and Column 5 (Widget Total)
As requested a working example:
<style>

.negative { background: lightcoral;  }
.positive { background: #91b496; }

</style>

<script>

  my_data=[
	    {company:"Company_01",organization:"Organization_01",non_compliant:3,compliant:7,total:10,percent_compliant:70.00,trend:-4},
	    {company:"Company_01",organization:"Organization_02",non_compliant:0,compliant:2,total:2,percent_compliant:100.00,trend:2},
	    {company:"Company_01",organization:"Organization_03",non_compliant:0,compliant:4,total:4,percent_compliant:100.00,trend:1},
        {company:"Company_01",organization:"Organization_04",non_compliant:0,compliant:3,total:3,percent_compliant:100.00,trend:2},
        {company:"Company_01",organization:"Organization_05",non_compliant:0,compliant:1,total:1,percent_compliant:100.00,trend:0},
        {company:"Company_01",organization:"Organization_06",non_compliant:0,compliant:1,total:1,percent_compliant:100.00,trend:0},
        {company:"Company_01",organization:"Organization_07",non_compliant:0,compliant:75,total:75,percent_compliant:100.00,trend:3},
        {company:"Company_01",organization:"Organization_08",non_compliant:36,compliant:60,total:96,percent_compliant:62.50,trend:-19},
        {company:"Company_02",organization:"Organization_09",non_compliant:5,compliant:59,total:64,percent_compliant:92.18,trend:25},
        {company:"Company_02",organization:"Organization_10",non_compliant:10,compliant:56,total:66,percent_compliant:84.84,trend:30},
          ]

   const dashboard_01 = new dhx.Grid("my_dashboard",
    {
   	columns:
      [

    	{ width: 125, id: "company", header: [{ text: "Company"},{content: "selectFilter"}]},
    	{ width: 150, id: "organization", header: [{ text: "Organziation" },{ content: "inputFilter" }] },
    	{ width: 150, id: "non_compliant", header: [{ text: "Non-Compliant" }], footer: [{ content: "sum"}] ,  type: "number", format: "#" },
    	{ width: 150, id: "compliant", header: [{ text: "Compliant" }], footer: [{ content: "sum"}], type: "number", format: "#"  },
        { width: 150, id: "total", header: [{ text: "Widget Total" }], footer: [{ content: "sum"}],  type: "number", format: "#"  },
        { width: 180, id: "percent_compliant", header: [{ text: "Percent Compliant",align: "right" } ], footer: [{ content: "avg",align: "right"}],  align: "right" },
        { width: 100, id: "trend", header: [{ text: "Trend",align: "right" } ], footer: [{ content: "sum"}],

          mark: function (cell, data,row,col)
              {
               if (cell < 0) {return cell < 0 ? "negative" : ""}
               if (cell > 0) {return cell > 0 ? "positive" : ""}
              },


          type: "number", format: "#"  }


		  ], selection:"row"
    });

  dashboard_01.data.parse(my_data);

</script>

<div style="width: 1000px;height: 400px;" id="my_dashboard"></div>