I have my histogram set up. This is what it looks like in the default Day view.
As you can see the green and red background takes up the entire cell background.
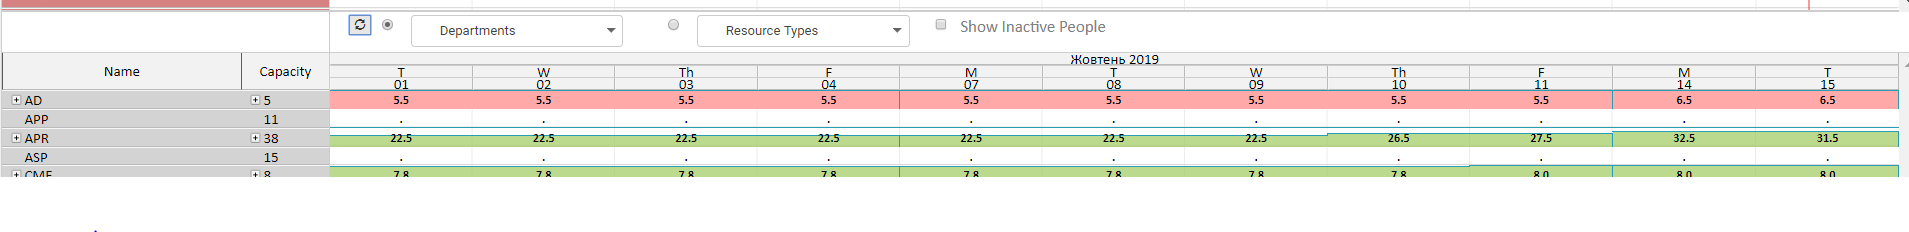
However when I switch to a custom view, the green and red don’t span the entire cell.

Here is where I apply the styles
gantt.templates.histogram_cell_class = function (start_date, end_date, resource, tasks) {

    let totalEffort = ...

    let css = '';

    if (totalEffort > resource.capacity) { //1 = 8h or 100% allocation
       css = "column_overload";
    }
    else if (totalEffort > 0)
        css = "column_steady";

    return css;


}.bind(this);
Here are my styles
.gantt_histogram_fill {
    background-color: rgba(176, 176, 176, 0.2);
}

.column_steady .gantt_histogram_fill {
    background-color: rgba(160, 202, 92, 0.7);
}

.column_overload .gantt_histogram_fill {
    background-color: #ffa9a9;
}
How can I get the background to fill the entire cell when the scale changes widths?