Hi,
How can I make the histogram chart using bar chart?
Is there any way to remove gaps between bar graphs?
The attached graph is the histogram chart by JFreeChart. I want to make this kind of graph.
Hi,
How can I make the histogram chart using bar chart?
Is there any way to remove gaps between bar graphs?
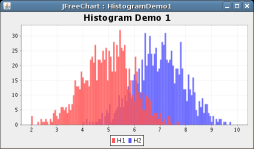
The attached graph is the histogram chart by JFreeChart. I want to make this kind of graph.
Hi,
How can I make the histogram chart using bar chart?
Our charts doesn’t allow to draw a chart like in the picture.
Is there any way to remove gaps between bar graphs?
There is not a public method to remove gaps.
I’m using DHTMLX 3.5 pro so I would like to change the source code of dhtmlxchart.js to remove gaps. It could make a bar graph as histogram what I want. Please send me e-mail how/where I need to change in the source code of dhtmlxchart.js.
It could make a bar graph as histogram what I want.
Gaps between bars can be removed by code modification. However, there is not opportunity to display one series of bars over another as it is dislayed in the picture. Are you still interested about “gap” modification ?
Yes, I’m interested in removing gaps only. I understand bar chart can’t be displayed over other bar chart.
Try to locate the following codebase/dhtmlxchart.js:
this._series&&u*this._series.length+4>o&&(u=parseInt(o/this._series.length-4,10));
and replace it with
this._series&&u*this._series.length>o&&(u=parseInt(o/this._series.length,10));