How change size of xAxis scale text ???
Hi
.dhx_axis_item_x{font-size: 24px}
please can you show a sample where in code i must use it ?
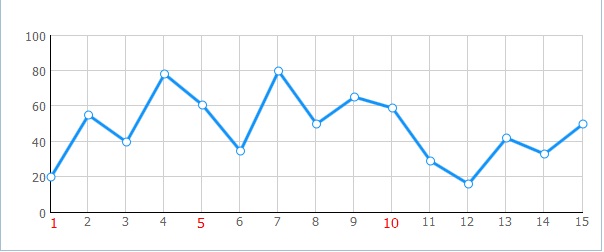
i want show in xAxis like that
1 2 3 4 5 6 7 8 9 10
1,5,10 - 14px
2,3,4,6,7,8,9 - 12px
it’s possible ??
i solved my problem
Yes
I add red color for effect:
xAxis: {
                        template: "'#year#",
                        start: 0,
                        end: 20,
                        step: 5,
                        template: function(obj) {
                            if (obj.id == 1  || obj.id ==  5 || obj.id ==  10){
                                return  "<span style='font-size:14px; color: red'>"+obj.year+"</span>";
                            }
                            return "<span style='font-size:12px'>"+obj.year+"</span>";
                        }
                    }
Darya please answer for my last question )
How can i get the last yAxis value in javacode ???
my yAxis can chanched from 0 to …
while max yAxis value less than 900 it’s look ok and step =100
yAxis - (0,100,200,300,400,500,600,700,800,900)
but when max yAxis value 950 and more
yAxis - (0,500,1000)
How i can use step 100 on yAxis, but i don’t want set start and end value
because end value can be 1000 or 1500 and i need scale step 100 …
You can get id of the last point, then get the hash of data, related to it and get its property:
chart.get(chart.last()).propertythx a lot
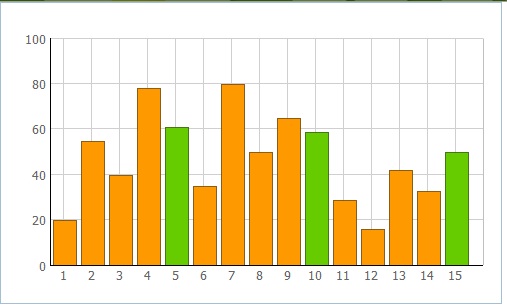
Darya if i have xAxis values 10 20 30 40 50 60 70 80 90 100
can i show bold (or another color) vertical grid line for values 50 and 100 on xAxis ???
color: function(obj){
            if (obj.id % 50) return "#ff9900";
            return "#66cc00";
        },
Here i set it to %5:
Darya thx for your help, sorry maybe i not correctly explaine what i mean
i want change color not for graphic line, i want change color grid at a background for 5 and 10 (in your grapchic gray vertical line)
and Darya can you please give link for example, i can’t understand what must i did (i need step 100 but i don’t know max value) …
You can get id of the last point, then get the hash of data, related to it and get its property:
chart.get(chart.last()).property
Darya can you please give link for example, i can’t understand what must i did …
???
i want change color not for graphic line
There is no such possibility.
thx a lot
Hello,
try to use lineColor template for xAxis. This property is not included in Chart docs - we’ll necessary add add this feature.
Here is the example:
...
xAxis:{
      template:"'#label#",
      lineColor: function(obj){
	    return obj.label%5?"#cfcfcf":"#999"
      }
},
...