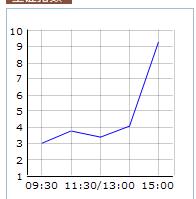
I want to draw a chart on a web page,but the x scale is a period starts from 9:30 to 15:00
but the default of the start of x scale is always zero, there be a blank between zero and 9:30
pleas guide me,thanks.
Try to define offset:false in chart configuration:
var chart = new dhtmlXChart({
view:“line”,
offset:false,
…
});
Thanks,it take effect!
btw,is there a Summary of the configuration? I have read some demo,but I didn’t find that.
Yes, we have missed this property in the documentation. It is actual for line and area charts. We’ll necessary add it.