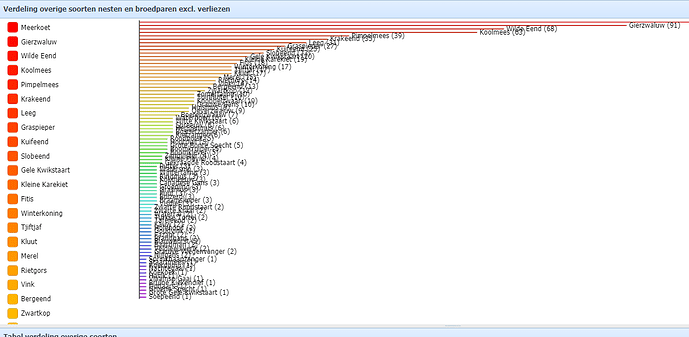
First a would let you show what i have at this moment.
You wil see that the legende is stretch out but the horizontal bar is not.
If i change the size off the grid the legende stay the same but the bars are increasing or decreasing.
I would like to have the bars the full height so i can get a scroll bar on the left site to scroll up and down.
My code is:
function soortverdelingoverig() {
statusBar = dhxLayout.attachFooter("gridFooter");
dhxLayout.cells("b").setText("Verdeling overige soorten nesten en broedparen excl. verliezen");
dhxLayout.cells("b").setHeight(500);
dhxLayout.cells("c").setText("Tabel verdeling overige soorten");
document.getElementById('pagingArea').innerHTML = '';

var chartConfig = {
    container: "chart_container",
    view: "barH",
    value: "#totaal#",
    label: "#id# (#totaal#)",
    padding: {
        top: 3,
        right: 150
    },
    group: {
        by: "#data4#",
        map: {
            totaal: ["#data6#", "sum"]
        }
    },
    legend: {
        width: 165,
        align: "left",
        valign: "top",
        template: "#id#",
    },
    sort: {
        by: "#totaal#",
        as: "int",
        dir: "desc"
    }

};
dhxChart = dhxLayout.cells("b").attachChart(chartConfig);
