Hi I want to set a custom month(0-11) as a quarter start, if there any api available to set that? or should I need to implement a custom scale for that?
Hello Vyshnav,
The scale with the quarter unit starts from the first month of the year.
If you use the month unit and the step: 3 parameter, the quarter start will depend on the displayed date range (the most left date of the timeline).
If you want to set a specific month that doesn’t depend on the displayed date range, you need to implement a custom scale:
https://docs.dhtmlx.com/gantt/desktop__configuring_time_scale.html#customtimeunits
Here is an example of how it can be implemented:
https://snippet.dhtmlx.com/5yws9nk0
Hi Ramil,
the issue with first apprroach is (ie; setting month unit and the step: 3) if the start date month is not quarter start then it will assign the wrong quarter for the next two months, is there any API available to set scale_start_month, I tried gantt.config.start_date but the scale start date is different from that.
In the second approach (ie; creating a custom unit) I checked both the documentation and the example shared by you.
In your example, you are simply returning the same date from the custom_quarter_start which will lead to the wrong quarter for the first month. I tried to update date from custom_quarter_start like the fisical_year example mentioned in the documentation but it leads to an infinite loop.
Hello Vyshnav,
the issue with first apprroach is (ie; setting month unit and the step: 3) if the start date month is not quarter start then it will assign the wrong quarter for the next two months, is there any API available to set scale_start_month, I tried gantt.config.start_date but the scale start date is different from that.
You need to specify both gantt.config.start_date and gantt.config.end_date parameters to set the displayed date range:
https://docs.dhtmlx.com/gantt/api__gantt_start_date_config.html
In the second approach (ie; creating a custom unit) I checked both the documentation and the example shared by you.
In your example, you are simply returning the same date from the custom_quarter_start which will lead to the wrong quarter for the first month. I tried to update date from custom_quarter_start like the fisical_year example mentioned in the documentation but it leads to an infinite loop.
Thank you for the clarification. The issue is not in the function that calculates the dates for the quarter scale cells. It is with the function that returns the quarter value.
When I checked that, I didn’t notice the wrong values in the first cell.
In fact, we need to increase the month value by 1 because it starts from 0. Then we need to add the quarterStart variable as it defines the shift of the start month of the quarter.
I updated the snippet:
When you create a custom scale, you need to know that if the inc parameter is positive, the returned date cannot be lower than the initial date in the date parameter.
Hi Ramil,
the code snippet that you shared for setting quarter start is not working properly, if I set quarter_start as 7 it is displaying timeline header as Q5, Q6 which is not expected.
Based on the replay you last gave me I came up with a solution, but that also has some issues, I am attaching that snippet here. I am able to set a custom month as quarter_start using a custom template for scale, create a custom unit for quarter, and settings gantt.config.start_date as the start of a quarter(ie: if Jan is quarter_start and the default start date is Feb I will set Jan as the start date because Jan is the start of Q1, otherwise customizing label from scale template will show wrong header). The issue is with this approach it will create 1-4 columns before the first date based on the scenario which does not look good on UI. do you have any alternative or better solution to set the quarter start?
Or is there any way we can avoid or hide that additional date column in the timeline section ?
Hello Vyshnav,
Thank you for letting me know that the snippet I shared still has issues with the logic that calculates the dates for the quarter cells and the quarter number.
I decided to check all the possible values myself and found that when the quarter starts in October, the first quarter cell can take up to 5 cells!
So, I created this snippet where you can experiment with the logic without fearing that the page will hang:
https://snippet.dhtmlx.com/lltngand
Then I created another snippet with several Gantt instances that only display the scales:
https://snippet.dhtmlx.com/hm6a0vml
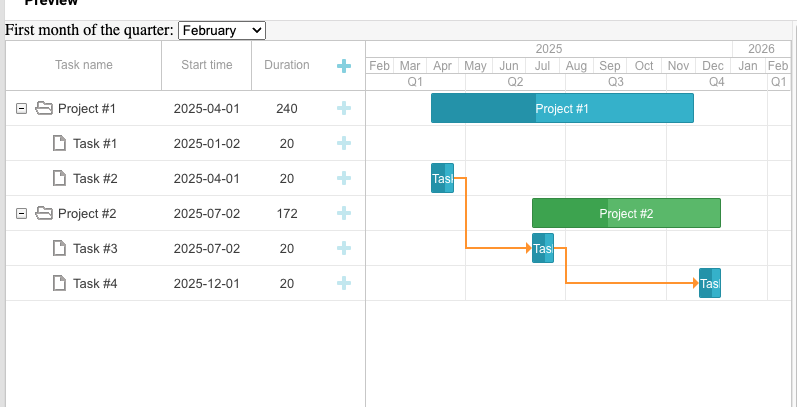
This allows you to instantly test the logic for all Quarter start months. And you can change the displayed date range to make sure that it will work correctly regardless of the start date of the timeline. You will need to increase the width size of the Preview frame if you see the scrollbars.
Here is the updated snippet:
Hi Ramil,
Thank you for the solution, this is the expected result, it works fine when I’m using gantt.config.scales but when I used gantt.ext.zoom.init for scale it created some issues, I’m attaching two snippets below with the issues I faced.
- Snippet shared by you for the custom quarter start, I used zoom.init rather than gantt.config.scales when you change the quarter start to February the quarter scale becomes last level which is not an expected behavior
- I used custom data for testing this quarter start, and here the scale does not start from the start date, this also works fines when I used gantt.config.scales , issue only occur when I am using zoom extension.
Hello Vyshnav,
Snippet shared by you for the custom quarter start, I used zoom.init rather than gantt.config.scales when you change the quarter start to February the quarter scale becomes last level which is not an expected behavior
Gantt uses the following function to sort scales:
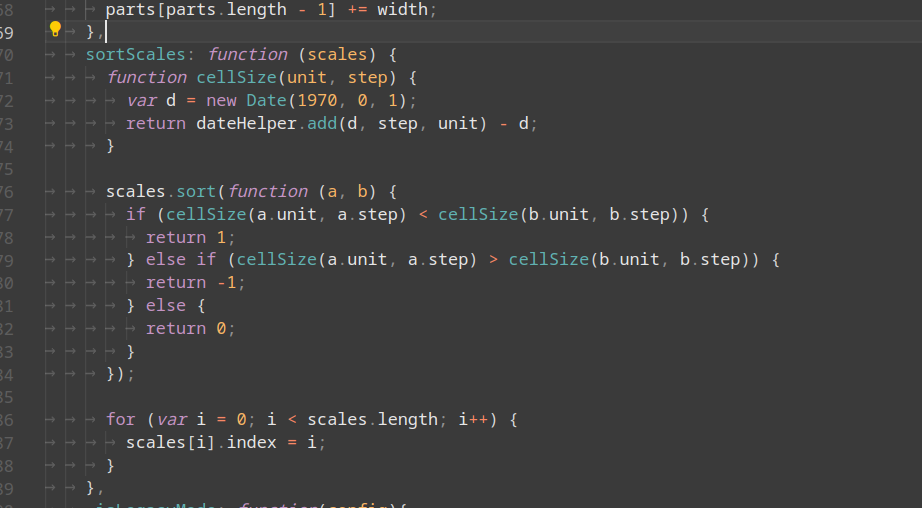
I checked that for February, both units (“month” and “custom_quarter”) return the same values in the
cellSize function. So, for Gantt, there is no need to sort the scales, and they will be displayed the same way they are listed in the Scales array.The issue here is with the configuration.
In the Zoom scales configuration, the month scale is above the quarter scale, so, when there is no need to sort these 2 scales, Gantt won’t do that. And that is why sometimes the custom quarter scale is displayed above the month scale.
In the gantt.config.scales configuration, the month is below the quarter scale, so, it will always be displayed at the bottom:
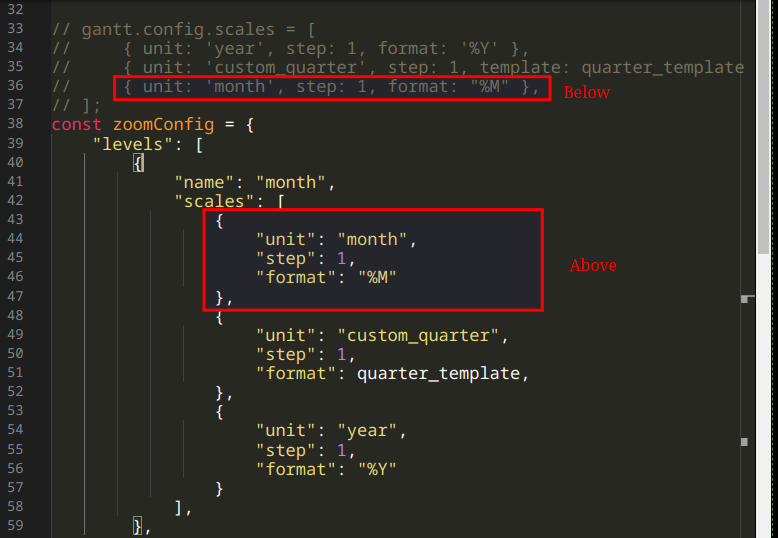
It will work the same way in the Zoom configuration if you have the same order as in the
gantt.config.scales array:https://snippet.dhtmlx.com/h7sbow5d
I used custom data for testing this quarter start, and here the scale does not start from the start date, this also works fines when I used gantt.config.scales , issue only occur when I am using zoom extension.
This thing is related to the scale configuration as described above. It can be fixed by setting the correct order of the scales.
However, here is the explanation for better understanding. As the lowest scale is the custom quarter scale, it becomes the basic unit. And as the add_custom_quarter doesn’t include the scenarios for the negative inc parameter, instead of showing the Q4 cell and date, it shows Q2. After adding the code for that scenario, it shows the correct dates:
gantt.date.add_custom_quarter = function (date, inc) {
    const month = date.getMonth()
    let add = 3 - month % 3 + quarterStart % 3
    if (add > 3) {
        add -= 3
    }
    return gantt.date.add(date, add * inc, "month");
};
1 Like
Hi Ramil,
Thank you so much, this fixed the issue.