How can I specify the leading and trailing timespan? Currently the leading timespan is one period of date scale and the trailing timespan is also one period of date scale. When using a year as date scale with a sub scale of week or day this results in very much wasted space left and right of my data.
Is there a possibility to specify how much time before first data the gantt should start to render and how much time after last data it should finish rendering?
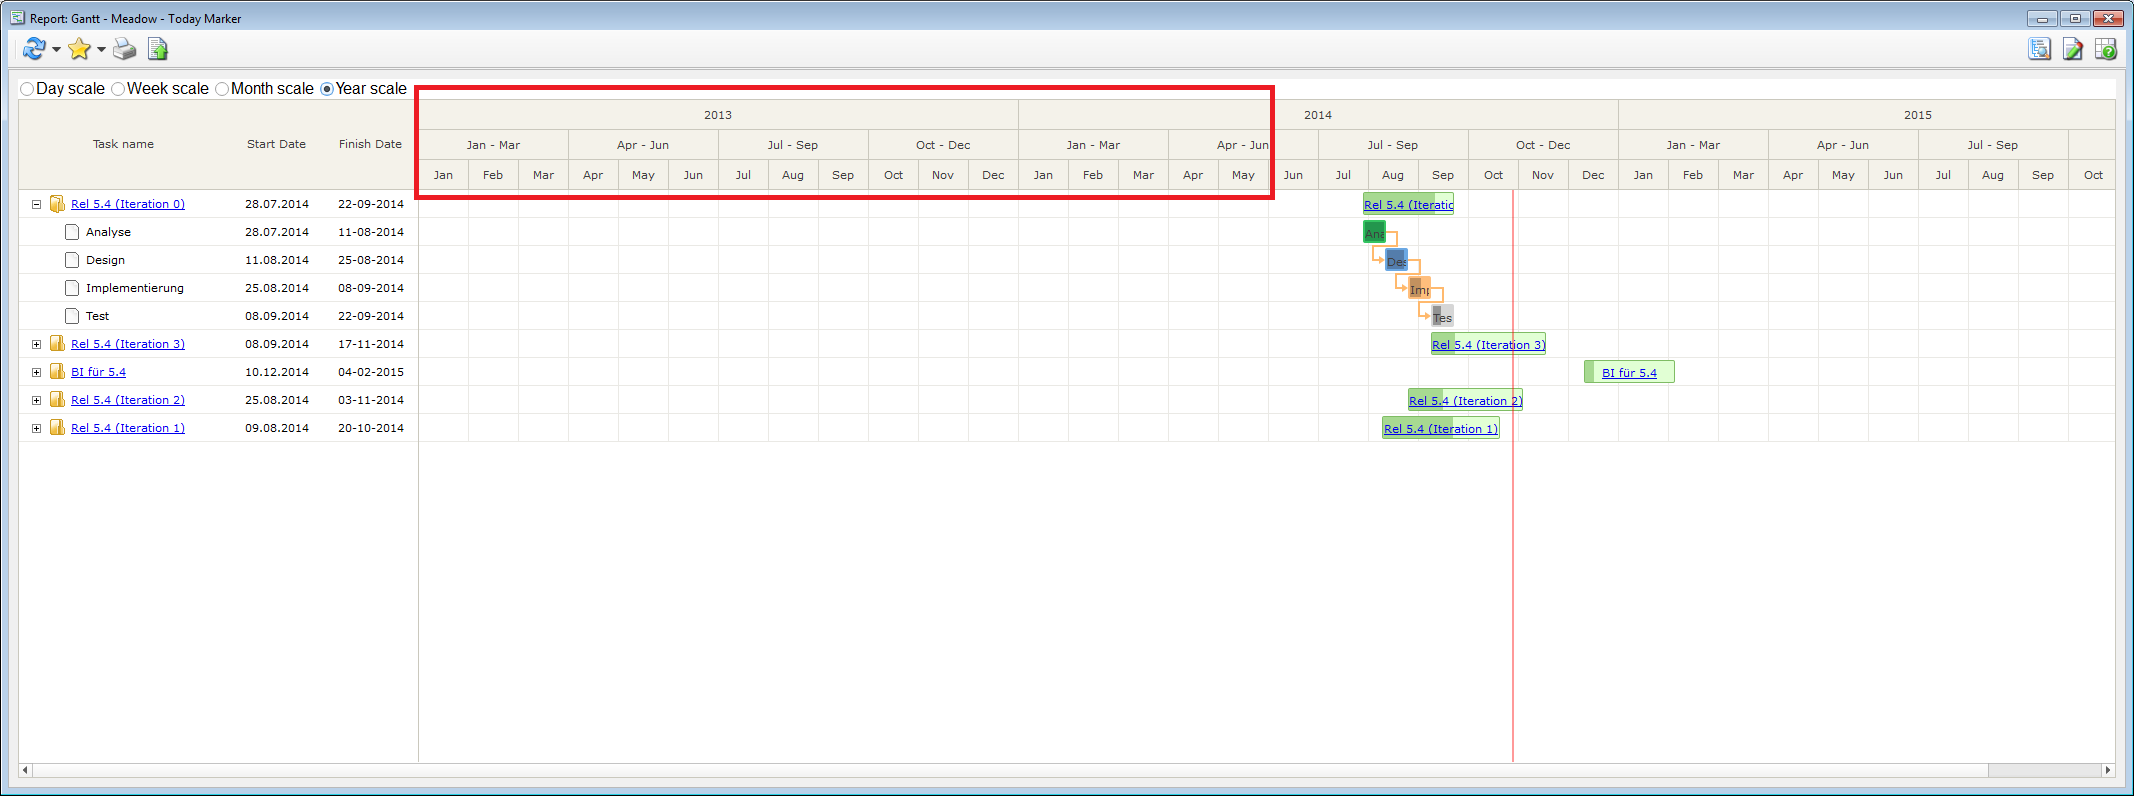
In the screenshot I marked with a red box the timespan which I like to suppress, because there is no data for that. So this is much wasted space.
Hi,
This behavior should has been corrected in version 3.1
gantt adds one scale column before and after visible tasks. In versions 2.x-3.0 it has used a unit specified in scale_unit config (in this example - year), starting from version 3.1 it uses minimal scale unit for the offset:
docs.dhtmlx.com/gantt/samples/03 … _year.html
Sample:
docs.dhtmlx.com/gantt/api__gantt … onfig.html
So for 2.0 to 3.0 the work around is to set the scale_unit to “month” instead of “year” and make the year a sub scale.
Both solutions (updating to 3.1 as suggested by you) as well as my suggested work around result in the quarters no longer being align to January. I now get a quarter from June to August, because the first month having data is July. So this is ugly.
This could be solved, if you implement a new unit “quarter”, which then begins with a shortened quarter for the empty June followed by a full quarter for July to September and so on.
Hi,
currently year quarters are not supported by gantt, so offset is getting aligned by months.
You can define a quarter unit from the code, it requires defining a two functions:
gantt.date.add_quarter and gantt.date.quarter_start where “quarter” in methods name is the name of the new unit.
Following code seems working (tested on gantt/samples/03_scales/03_full_year.html example):
[code]// defining methods
gantt.date.quarter_start = function(date){
gantt.date.month_start(date);
var m = date.getMonth(),
res_month;
if(m >= 9){
	res_month = 9;
}else if(m >= 6){
	res_month = 6;
}else if(m >= 3){
	res_month = 3
}else{
	res_month = 0
}

date.setMonth(res_month);
return date;
};
gantt.date.add_quarter = function(date, inc){
return gantt.date.add(date, inc*3, “month”);
};
// sample code
gantt.config.scale_unit = “year”;
gantt.config.step = 1;
gantt.config.date_scale = “%Y”;
gantt.config.min_column_width = 50;
gantt.config.scale_height = 90;
var monthScaleTemplate = function(date){
var dateToStr = gantt.date.date_to_str("%M");
var endDate = gantt.date.add(date, 2, “month”);
return dateToStr(date) + " - " + dateToStr(endDate);
};
gantt.config.subscales = [
{unit:“quarter”, step:1, template:monthScaleTemplate},
{unit:“month”, step:1, date:"%M" }
];
gantt.init(“gantt_here”);[/code]