I have a pro license.
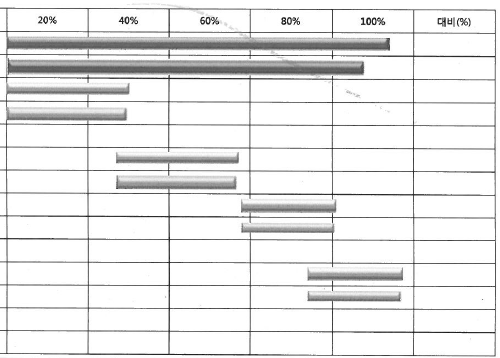
I can not find the chart above is need. Help.
Without this feature, you have free charts Please introduce.
Hello
Please, reattach your imeage
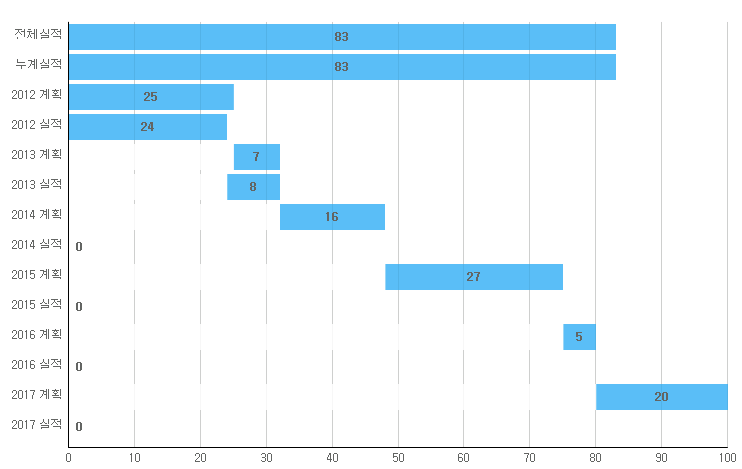
I was hard in order to create the above chart.
But not perfect. Help ~
Why can I not display the yAxis line?
source
function onLoadCahrt() {
    var barChart = new dhtmlXChart({
        view: "stackedBarH",
        container: "chartDiv",
        value: "#sales#",
        //label: "#sales#",
        color: "#ffffff",
        border: false,
        width: 30,
        alpha: 0.8,
        padding: { left: 80 },
        //origin:2,
        xAxis: { start: 0,
            step: 10,
            end: 100,
            lines: true
        },
        yAxis: {

            lines: true,
            template: "#year#"
        }
    })
    barChart.addSeries({
        value: "#sales1#",
        color: "#36abee",
        label:  "<font style='font-size: 13px;font-weight:bold;'>#sales1#</font>"
    });

    var chartData = convertData(data);
    //alert(chartData[10].sales);
    barChart.parse(chartData, "json");

}
Please, chech this link:
dhtmlx.com/docs/products/dhtmlxGantt/index.shtml
I think you need dhtmlxGantt