I want to use addMarkedTimepan to achieve segmentation effect. Is there a ready-made demo to refer to?

Here’s my data

 {
      key: 1,
      label: "James Smith",
      start_time: "2024-08-24 08:30:00",
      end_time: "2024-08-24 12:30:00",
      height: 60,
    },
    {
      key: 41,
      label: "James Smith",
      start_time: "2024-08-24 14:30:00",
      end_time: "2024-08-24 16:30:00",
      height: 60,
    },
    {
      key: 2,
      label: "John Williams",
      start_time: "2024-08-24 08:30:00",
      end_time: "2024-08-24 12:30:00",
      height: 60,
    },
    {
      key: 3,
      label: "David Miller",
      start_time: "2024-08-24 08:30:00",
      end_time: "2024-08-24 12:30:00",
      height: 60,
    },
    {
      key: 4,
      label: "Linda Brown",
      start_time: "2024-08-24 08:30:00",
      end_time: "2024-08-24 12:30:00",
      height: 60,
    },

The effect achieved is this:
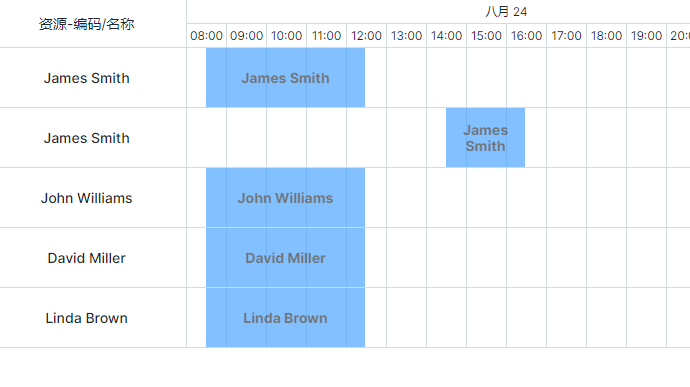
demo2

This is what I want to do:

Hello @dahao ,

As I understand, you are creating something like event cards but using the addMarkedTimespan am I right?

If so, the data in your dataset contains incorrect fields, as key/height/label, so I don’t completely understand what exactly you are doing.

So it’s not a common use case, but technically should be possible.

Could you please reproduce your current config in the following demo:

(open the demo => reproduce your current config => click the “Save” button => post here the new link).
https://snippet.dhtmlx.com/ut52cstn

Kind regards,

Thank you, I have discovered and solved this problem