Hi
I wanted to assign arbitrary date values to the x-axis. i wanted to know if dhtmlxchart will make the calculations accordingly and adjust how it is being displayed in the chart?
suppose the x- axiz values are : [ 1/5/2016, 1/8/2016, 1/9/2016, 1/12/2016]
I want x-axis to show there are data points on 1/6/2016, 1/7/2016, 1/10/2016,1/11/2016.
and if the we can pass the date object as input?
I am able to plot it using the demo link
dhtmlx.com/docs/products/dhtmlxC … _axis.html
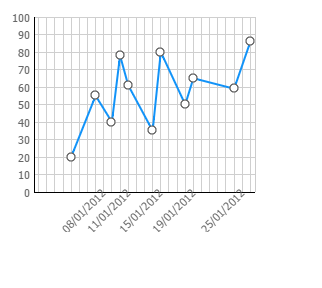
but the chart is generated as attached .
I want more space between each unit x-Axis , is there any way we expand the space between 2 dates i.e 08/01/2016 and 09/01/2016

I want more space between each unit x-Axis
Chart size depends on a container size. Please the width of the container where you created the chart.
Thanks, but how do we pass the object date as input.
please provide some syntax or documents which might help
Unfortunately it is not available to pass the dates to a chart as inputs.
