Using dhtmlxChart latest version, I could get clustered bar charts working no problem (add series, use bar view type, done). I could also get stacked bar charts (replace view type with stackedBar, done).
But now I’d like to get clustered stacked bars: for an abscissa value (xAxis if not horizontal), have multiple columns (as with clustered bar charts), with subdivisions inside (as with stacked bar charts). I tried to look into group property, but it just performs aggregations over all values so can’t use for this.
I can’t find any way to tell dhtmlxChart to do that, would you have any pointer?
To make what I need clearer, this: jsfiddle.net/highcharts/Mtp4Y/ is an example using Highcharts library (has native support for clustered stacked barchart)
There are tutorials for doing that in Excel/Numbers (Office 2007 version) as they don’t support clustered stacks either. Maybe it would be possible to use that with dhtmlx, but it’s hacky and it would require changing many spacings and adding dummy data columns (maybe), I’m not even sure it is possible to style dhtmlx that much, so if there is a simpler solution I’d rather go with that.
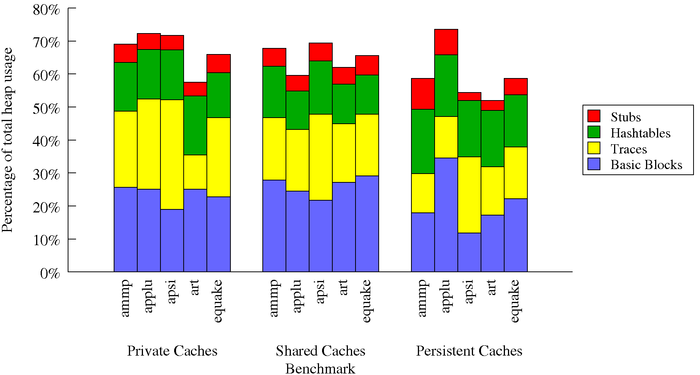
Other example from bargraph perl utility: