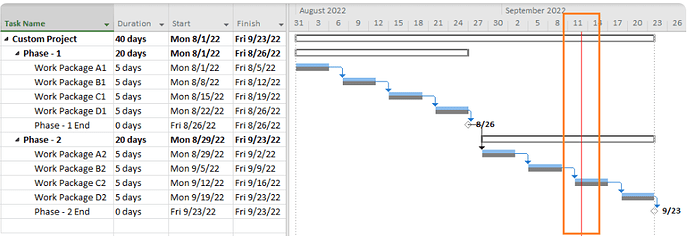
I would like to see two parallel bars of planned vs actual against the same task in my Gantt, like this picture below. How can I achieve it?
Hello Gopal,
Right now, Gantt doesn’t have a built-in way to show baselines. But you can use the Gantt API to implement that.
You can use the addTaskLayer method that allows showing any HTML elements in the timeline:
https://docs.dhtmlx.com/gantt/api__gantt_addtasklayer.html
Here are examples of the implementation:
https://docs.dhtmlx.com/gantt/samples/?sample='04_customization/15_baselines.html'&filter='baseline'
In the future, the dev team will add a built-in way to show baselines. But I cannot give you any ETA.
