Line chart series problem for not to display certain data

hi all,

i am facing an issue for a long but didn’t get resolved so posting it here. this is related to line chart in series (multiple lines in one chart)
in my line chart i have 3 series. below sample xml file contains the data for them.

8.571428 3 2.9 2000 7.142857 8 3.5 2001 5.714286 1 3.1 2002 4.285714 0 4.2 2003 2.857143 5 4.5 2004 1.4285715 6 7.4 2005 0 8 9.6 2006

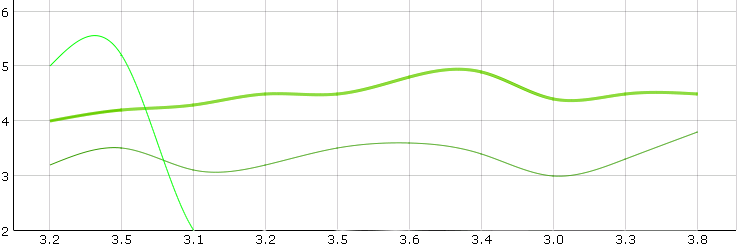
“companyC” data represents a straight line. all data is for 2000 to 2006. all 3 lines are displaying properly.

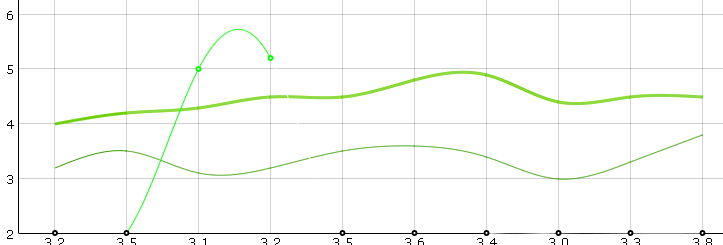
What I want : if there is no such data from year 2003 onwards for “companyA” and “companyB” then in, chart i can see only 2 lines, 1 is for “companyC” and one is for “companyA”. please help.

below is the html code for them.

Scales window.onload = function(){ var chart1 = new dhtmlXChart({ view:"line", container:"chart1", value:"#companyC#", item:{ borderColor: "#0000ff", color: "#ffffff" }, line:{ color:"#0000ff", width:3 }, xAxis:{ title:"Year", template:"#year#" }, yAxis:{ title:"Sales Per Year", }, padding:{ left:35, bottom:20 }, origin:0, legend:{ layout:"x", width: 75, align:"center", valign:"bottom", marker:{ type:"round", width:15 }, values:[ {text:"company A",color:"#00ff00"}, {text:"company B",color:"#ff0000"}, {text:"company C",color:"#0000ff"} ] } }); chart1.addSeries({ value:"#companyA#", label:"#companyA#", item:{ borderColor: "#00ff00", color: "#ffffff" }, line:{ color:"#00ff00", width:3 }, }); chart1.addSeries({ value:"#companyB#", label:"#companyB#", item:{ borderColor: "#ff0000", color: "#ffffff" }, line:{ color:"#ff0000", width:3 }, });
	chart1.load("sales.xml","xml");
}
</script>

Hi,

So, you do not want to show a line for some years, do you ?

If the background is white, you may set line colors “white” certain years.

For example, if you need to hide a line for companyA from 2003 year, you need to set some property in the xml for these years(for example “hide”):

[code]…

4.285714
0
4.2
2003

  <hide>1</hide>
...[/code]

and define the template for line colors:

chart1.addSeries({ value:"#companyA#", label:"#companyA#", item:{ borderColor: function(obj){ return obj.hide?"#ffffff":"#00ff00"; }, color: "#ffffff" }, line:{ color:function(obj){ return obj.hide?"#ffffff":"#00ff00"; }, width:3 } });

thanks Alexandra,
the solution is quite good and I applied. it’s working properly as the background is white…but as we have to show the grid-lines also in the chart so it’s causing some while spot on grid-lines as they are light gray color… but it’s a good trick.
Thanks a lot.

it is possible to display one chart over another. Here are related posts:

viewtopic.php?f=8&t=15779&p=48096#p48096
viewtopic.php?f=8&t=15767

Possibly it will be helpful…

Hi Alexandra,

I have the same problem

Here you used loading XML file.

How can I do it for loading CSV files??

Please do help.

Hi,

the example of csv initialization is:
dhtmlxChart/samples/01_initialization/03_load_csv.html

Hi,

the example of csv initialization is:
dhtmlxChart/samples/01_initialization/03_load_csv.html

My code:
var data = "
3.2, 4, 5\n
3.5, 4.2, 5.2\n
3.1, 4.3,\n
3.2, 4.5,\n
3.5, 4.5,\n
3.6, 4.8,\n
3.4, 4.9,\n
3.0, 4.4,\n
3.3, 4.5,\n
3.8, 4.5,“;
//alert(data);
window.onload = function(){
var lineChart = new dhtmlXChart({
view:“spline”,
container:“chart_container”,
value:”#data0#“,
padding:{
bottom:20,
right:20,
left:20
},
item:{
borderColor: “#3399ff”,
color: “#ffffff”,
radius:0
},
line:{
color:”#339900",
width:1
},
xAxis:{
template:“#data0#”
},
yAxis:{
start:2,
step:1,
end:12
},

		border:false
	})
	lineChart.addSeries({
		value:"#data1#",
		item:{
			borderColor: "#66cc00",
			color: "#ffffff",
			radius:0
		},
		line:{
			color:"#66cc00",
			width:3
		}
	})
	lineChart.addSeries({
		value:"#data2#",
		item:{
          borderColor: function(obj){
          return obj.data2?"#00ff00":"#000000";
          },
          color: "#ffffff",
          radius:0
       },
       line:{
          color:function(obj){
          return obj.data2?"#00ff00":"#ffffff";
          },
		  width:1
	   }
	})

lineChart.parse(data,“csv”);
The third line has only two data (5 and 5.2). But the line goes to zero after 5.2. How to avoid it?


Try to use the following check:

color : function(obj){
var value = lineChart.get(lineChart.next(obj.id)).data2;
return value?"#00ff00":"#ffffff";
},

Thanks a lot.
It works.

Here we use
var value = lineChart.get(lineChart.next(obj.id)).data2;
to find the next data.
What shall we do get previous data, if my input is as follows??

var data = "
3.2, 4,\n
3.5, 4.2,\n
3.1, 4.3,5\n
3.2, 4.5,5.2\n
3.5, 4.5,\n
3.6, 4.8,\n
3.4, 4.9,\n
3.0, 4.4,\n
3.3, 4.5,\n
3.8, 4.5,";


previous method instead of next:

var value = lineChart.get(lineChart.previous(obj.id)).data2;

I tried “previous” method.

I got the error
Error: lineChart.get(lineChart.previous(obj.id)) is undefined

Please do help.

Thanks in Advance.

You may set a check:

if(lineChart.previous(obj.id))
var value = lineChart.get(lineChart.previous(obj.id)).data2;