does the line charts width have to be the same size with the chart container?
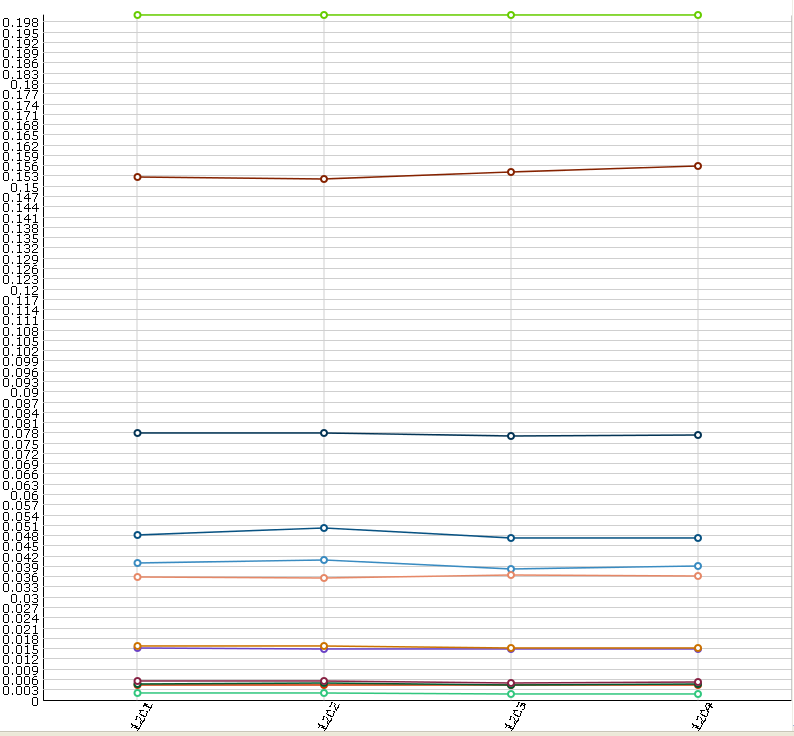
i need to draw a line chart with it’s container’s (the div) height =800 and the chart height = 1200px, so that i can view the chart by scrolling bar. so as to view the difference between line[ because the chart may have several lines with very small data(0.01), and it may also have several lines with very big numbers(100)]
You can use 2 containers:
- parent div that will have 800px height
- child div with 1200px height
<div style="width: 600px;height: 800px; overflow: auto">
   <div id="chartDiv" style="width:100%;height: 1200px;"></div>
</div>

<script>
    var chart =  new dhtmlXChart({
          view:"line",
          container:"chartDiv",
          ....
    });
</script>[/code]

Note that "x" axis is always drawn in the bottom if chart container. Therefore, you will see only yAxis if the div is not scrolled.

Some more remarks... In my opinion the following changes could help your chart look better:

1 -  try increase "step" of yAxis or use template of the yAxis to skip most of labels:

[code]yAxis:{
    template: function(value){
           return value%0.01==0?value:""
     }
}
2 - possibly it would be better to align xAxis labels horizontally and do not use rotation
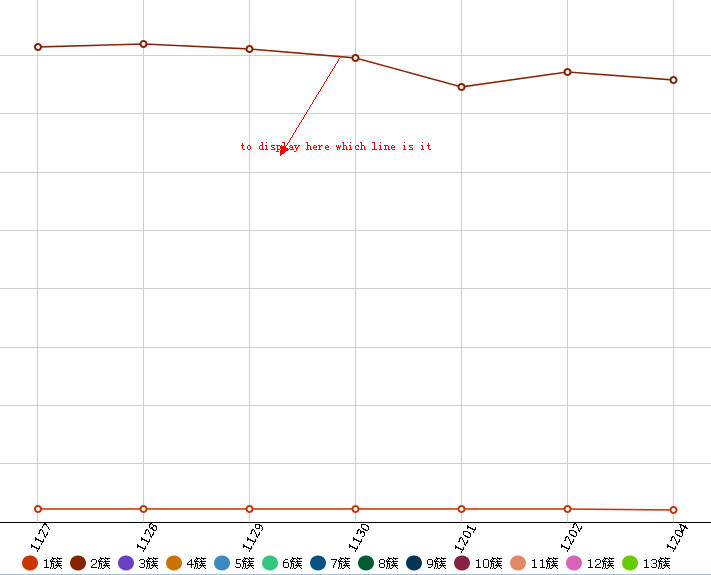
yes, i used the legend in the chart(you can see that from the picture i attched), but i also need to identify it beside the line, is there any way to do this?
You can use “label” property of Chart. It allow to set labels for items. However, it is a template and you can use this property to set label only for a certain item:
var myChart =  new dhtmlXChart({
         view:"line",
         label:function(obj){
                 return myChart.indexById(obj.id) == 3? "Line title":""
         },
        ...
});