Hi, i need your help
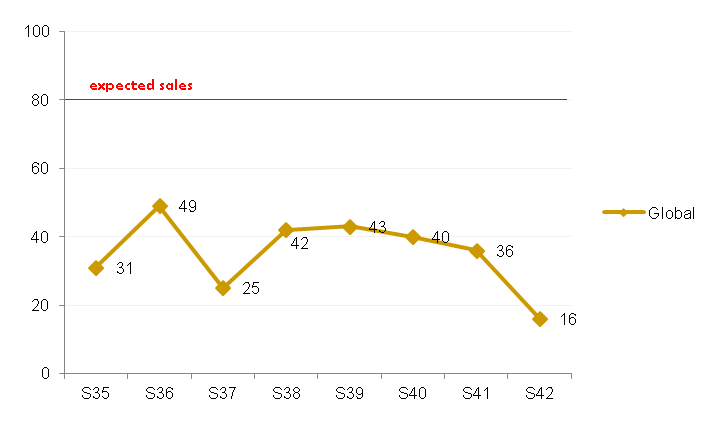
I have a chart that represents the monthly sales and need to add a static line that represents the expected sales, as I can do this with a line chart???
in advance thank you very much ![]()
Hi, i need your help
I have a chart that represents the monthly sales and need to add a static line that represents the expected sales, as I can do this with a line chart???
in advance thank you very much ![]()
Hi,
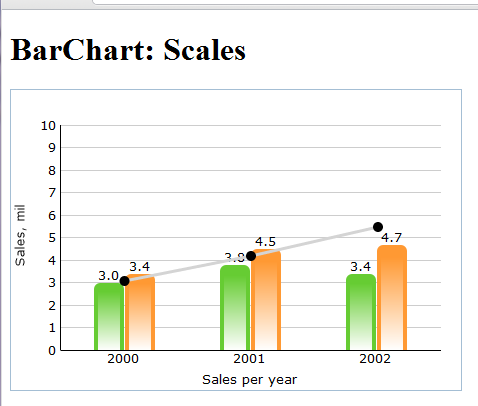
try using “series” functionality to draw an additional line:
dhtmlxChart/samples/05_line_chart/05_series.html
While there is no way to mix different type of charts, you can render on over another to have the necessary view.
05_series.zip (2.28 KB)
Hi,
The result I get is the image you attached:
And with the series is not how to implement it, could you please explain me.
In advance thank you very much ![]()
Alexandra, thank you very much