Hi,
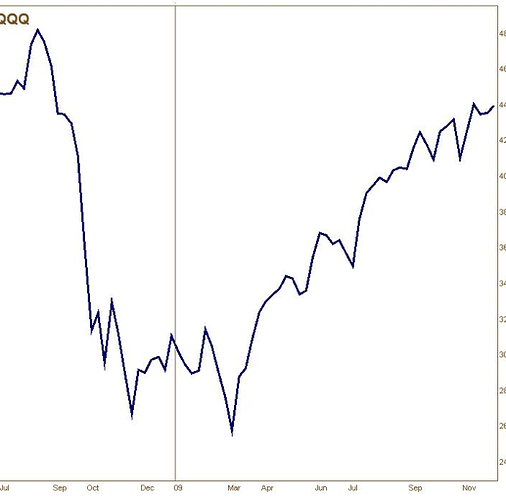
There is an request for appending some text explaining what happened at that time while indicating a specific time of the line by drawing one more more arrow images or a vertical lines at every specific times.
In detail, if there is a line chart showing product amount according to time change, some notifiable event at some specific time point should be appended with some arrow image or verticle line.
Do you think Dhx chart might meet the requirement above?
Thank you in advance.
